Haitian vs Immigrants from Netherlands Per Capita Income
COMPARE
Haitian
Immigrants from Netherlands
Per Capita Income
Per Capita Income Comparison
Haitians
Immigrants from Netherlands
$37,289
PER CAPITA INCOME
0.1/ 100
METRIC RATING
297th/ 347
METRIC RANK
$50,458
PER CAPITA INCOME
100.0/ 100
METRIC RATING
51st/ 347
METRIC RANK
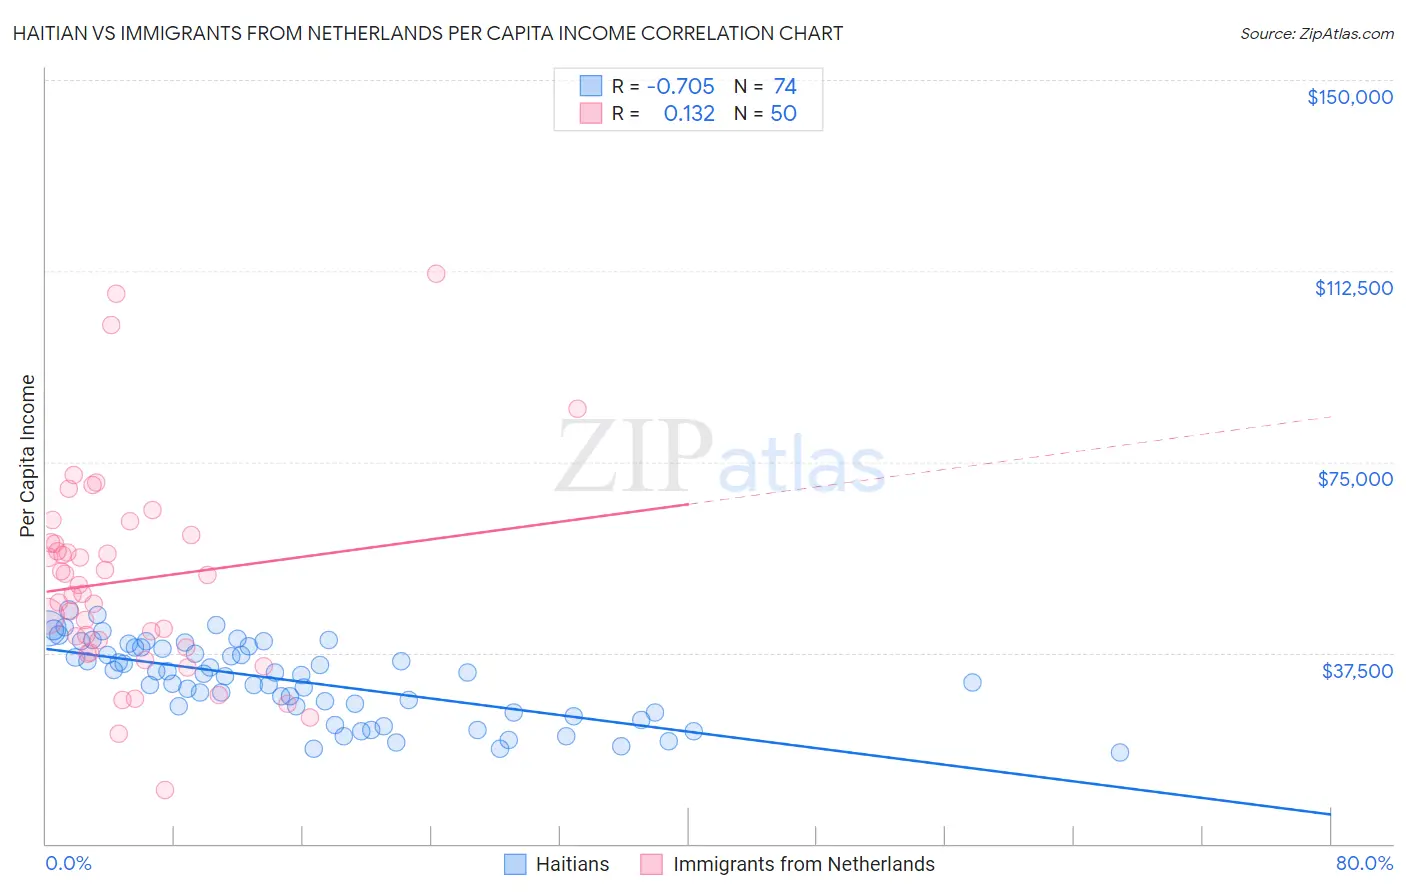
Haitian vs Immigrants from Netherlands Per Capita Income Correlation Chart
The statistical analysis conducted on geographies consisting of 288,031,086 people shows a strong negative correlation between the proportion of Haitians and per capita income in the United States with a correlation coefficient (R) of -0.705 and weighted average of $37,289. Similarly, the statistical analysis conducted on geographies consisting of 237,881,407 people shows a poor positive correlation between the proportion of Immigrants from Netherlands and per capita income in the United States with a correlation coefficient (R) of 0.132 and weighted average of $50,458, a difference of 35.3%.
Per Capita Income Correlation Summary
| Measurement | Haitian | Immigrants from Netherlands |
| Minimum | $17,858 | $10,464 |
| Maximum | $45,871 | $111,976 |
| Range | $28,013 | $101,512 |
| Mean | $31,987 | $51,773 |
| Median | $33,320 | $49,974 |
| Interquartile 25% (IQ1) | $25,885 | $38,654 |
| Interquartile 75% (IQ3) | $38,541 | $59,110 |
| Interquartile Range (IQR) | $12,656 | $20,456 |
| Standard Deviation (Sample) | $7,480 | $20,417 |
| Standard Deviation (Population) | $7,429 | $20,212 |
Similar Demographics by Per Capita Income
Demographics Similar to Haitians by Per Capita Income
In terms of per capita income, the demographic groups most similar to Haitians are Indonesian ($37,300, a difference of 0.030%), Immigrants from Dominican Republic ($37,306, a difference of 0.040%), Immigrants from Caribbean ($37,254, a difference of 0.090%), Cherokee ($37,203, a difference of 0.23%), and Cuban ($37,383, a difference of 0.25%).
| Demographics | Rating | Rank | Per Capita Income |
| Immigrants | Guatemala | 0.1 /100 | #290 | Tragic $37,550 |
| Cajuns | 0.1 /100 | #291 | Tragic $37,527 |
| Immigrants | Micronesia | 0.1 /100 | #292 | Tragic $37,464 |
| Mexican American Indians | 0.1 /100 | #293 | Tragic $37,407 |
| Cubans | 0.1 /100 | #294 | Tragic $37,383 |
| Immigrants | Dominican Republic | 0.1 /100 | #295 | Tragic $37,306 |
| Indonesians | 0.1 /100 | #296 | Tragic $37,300 |
| Haitians | 0.1 /100 | #297 | Tragic $37,289 |
| Immigrants | Caribbean | 0.1 /100 | #298 | Tragic $37,254 |
| Cherokee | 0.1 /100 | #299 | Tragic $37,203 |
| Immigrants | Bahamas | 0.1 /100 | #300 | Tragic $37,193 |
| Ottawa | 0.1 /100 | #301 | Tragic $37,101 |
| Shoshone | 0.1 /100 | #302 | Tragic $37,072 |
| Paiute | 0.1 /100 | #303 | Tragic $37,066 |
| Hondurans | 0.1 /100 | #304 | Tragic $37,031 |
Demographics Similar to Immigrants from Netherlands by Per Capita Income
In terms of per capita income, the demographic groups most similar to Immigrants from Netherlands are Immigrants from Croatia ($50,417, a difference of 0.080%), Paraguayan ($50,385, a difference of 0.14%), Immigrants from Sri Lanka ($50,555, a difference of 0.19%), New Zealander ($50,575, a difference of 0.23%), and Immigrants from Belarus ($50,303, a difference of 0.31%).
| Demographics | Rating | Rank | Per Capita Income |
| Immigrants | Europe | 100.0 /100 | #44 | Exceptional $50,950 |
| Immigrants | Spain | 100.0 /100 | #45 | Exceptional $50,933 |
| Immigrants | Latvia | 100.0 /100 | #46 | Exceptional $50,914 |
| Bulgarians | 100.0 /100 | #47 | Exceptional $50,906 |
| Immigrants | Serbia | 100.0 /100 | #48 | Exceptional $50,810 |
| New Zealanders | 100.0 /100 | #49 | Exceptional $50,575 |
| Immigrants | Sri Lanka | 100.0 /100 | #50 | Exceptional $50,555 |
| Immigrants | Netherlands | 100.0 /100 | #51 | Exceptional $50,458 |
| Immigrants | Croatia | 99.9 /100 | #52 | Exceptional $50,417 |
| Paraguayans | 99.9 /100 | #53 | Exceptional $50,385 |
| Immigrants | Belarus | 99.9 /100 | #54 | Exceptional $50,303 |
| Immigrants | Western Europe | 99.9 /100 | #55 | Exceptional $50,065 |
| Asians | 99.9 /100 | #56 | Exceptional $50,057 |
| South Africans | 99.9 /100 | #57 | Exceptional $50,044 |
| Immigrants | Malaysia | 99.9 /100 | #58 | Exceptional $49,983 |