Guyanese vs Guamanian/Chamorro College, 1 year or more
COMPARE
Guyanese
Guamanian/Chamorro
College, 1 year or more
College, 1 year or more Comparison
Guyanese
Guamanians/Chamorros
54.1%
COLLEGE, 1 YEAR OR MORE
0.1/ 100
METRIC RATING
282nd/ 347
METRIC RANK
58.6%
COLLEGE, 1 YEAR OR MORE
26.2/ 100
METRIC RATING
196th/ 347
METRIC RANK
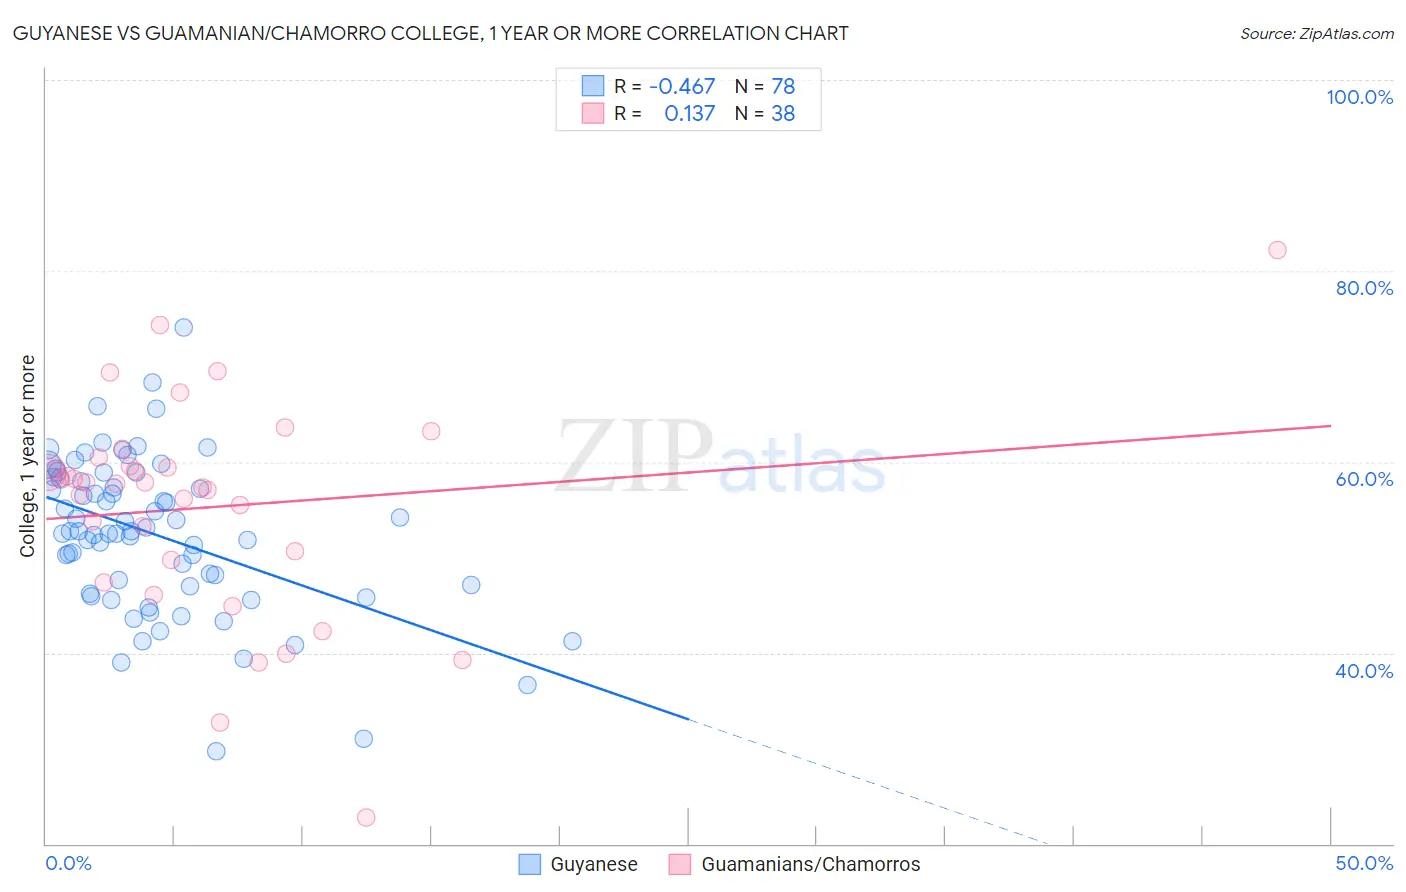
Guyanese vs Guamanian/Chamorro College, 1 year or more Correlation Chart
The statistical analysis conducted on geographies consisting of 176,939,437 people shows a moderate negative correlation between the proportion of Guyanese and percentage of population with at least college, 1 year or more education in the United States with a correlation coefficient (R) of -0.467 and weighted average of 54.1%. Similarly, the statistical analysis conducted on geographies consisting of 221,965,751 people shows a poor positive correlation between the proportion of Guamanians/Chamorros and percentage of population with at least college, 1 year or more education in the United States with a correlation coefficient (R) of 0.137 and weighted average of 58.6%, a difference of 8.3%.
College, 1 year or more Correlation Summary
| Measurement | Guyanese | Guamanian/Chamorro |
| Minimum | 29.6% | 22.8% |
| Maximum | 74.1% | 82.3% |
| Range | 44.4% | 59.5% |
| Mean | 52.4% | 55.2% |
| Median | 52.7% | 57.7% |
| Interquartile 25% (IQ1) | 47.0% | 49.7% |
| Interquartile 75% (IQ3) | 58.3% | 59.5% |
| Interquartile Range (IQR) | 11.3% | 9.9% |
| Standard Deviation (Sample) | 8.1% | 11.3% |
| Standard Deviation (Population) | 8.0% | 11.2% |
Similar Demographics by College, 1 year or more
Demographics Similar to Guyanese by College, 1 year or more
In terms of college, 1 year or more, the demographic groups most similar to Guyanese are Colville (54.1%, a difference of 0.040%), Cheyenne (54.1%, a difference of 0.050%), Arapaho (54.1%, a difference of 0.11%), Immigrants from Jamaica (54.2%, a difference of 0.13%), and Nicaraguan (53.9%, a difference of 0.36%).
| Demographics | Rating | Rank | College, 1 year or more |
| Americans | 0.2 /100 | #275 | Tragic 54.4% |
| Shoshone | 0.2 /100 | #276 | Tragic 54.3% |
| Ecuadorians | 0.2 /100 | #277 | Tragic 54.3% |
| Immigrants | Jamaica | 0.1 /100 | #278 | Tragic 54.2% |
| Arapaho | 0.1 /100 | #279 | Tragic 54.1% |
| Cheyenne | 0.1 /100 | #280 | Tragic 54.1% |
| Colville | 0.1 /100 | #281 | Tragic 54.1% |
| Guyanese | 0.1 /100 | #282 | Tragic 54.1% |
| Nicaraguans | 0.1 /100 | #283 | Tragic 53.9% |
| Ute | 0.1 /100 | #284 | Tragic 53.8% |
| Immigrants | Guyana | 0.1 /100 | #285 | Tragic 53.5% |
| Central American Indians | 0.1 /100 | #286 | Tragic 53.5% |
| Immigrants | Belize | 0.1 /100 | #287 | Tragic 53.5% |
| Alaska Natives | 0.0 /100 | #288 | Tragic 53.4% |
| Immigrants | Ecuador | 0.0 /100 | #289 | Tragic 53.4% |
Demographics Similar to Guamanians/Chamorros by College, 1 year or more
In terms of college, 1 year or more, the demographic groups most similar to Guamanians/Chamorros are Dutch (58.6%, a difference of 0.0%), Immigrants from Thailand (58.6%, a difference of 0.010%), Costa Rican (58.6%, a difference of 0.020%), Immigrants from South Eastern Asia (58.5%, a difference of 0.080%), and Peruvian (58.6%, a difference of 0.090%).
| Demographics | Rating | Rank | College, 1 year or more |
| Uruguayans | 31.8 /100 | #189 | Fair 58.8% |
| Immigrants | Cameroon | 31.2 /100 | #190 | Fair 58.8% |
| Immigrants | Philippines | 29.2 /100 | #191 | Fair 58.7% |
| Colombians | 27.6 /100 | #192 | Fair 58.7% |
| Peruvians | 27.5 /100 | #193 | Fair 58.6% |
| Costa Ricans | 26.4 /100 | #194 | Fair 58.6% |
| Dutch | 26.2 /100 | #195 | Fair 58.6% |
| Guamanians/Chamorros | 26.2 /100 | #196 | Fair 58.6% |
| Immigrants | Thailand | 26.0 /100 | #197 | Fair 58.6% |
| Immigrants | South Eastern Asia | 25.1 /100 | #198 | Fair 58.5% |
| Slovaks | 24.6 /100 | #199 | Fair 58.5% |
| Spanish | 24.2 /100 | #200 | Fair 58.5% |
| Nigerians | 23.0 /100 | #201 | Fair 58.5% |
| Immigrants | South America | 21.9 /100 | #202 | Fair 58.4% |
| Ghanaians | 20.9 /100 | #203 | Fair 58.4% |