Immigrants from Taiwan vs Guamanian/Chamorro College, 1 year or more
COMPARE
Immigrants from Taiwan
Guamanian/Chamorro
College, 1 year or more
College, 1 year or more Comparison
Immigrants from Taiwan
Guamanians/Chamorros
69.6%
COLLEGE, 1 YEAR OR MORE
100.0/ 100
METRIC RATING
4th/ 347
METRIC RANK
58.6%
COLLEGE, 1 YEAR OR MORE
26.2/ 100
METRIC RATING
196th/ 347
METRIC RANK
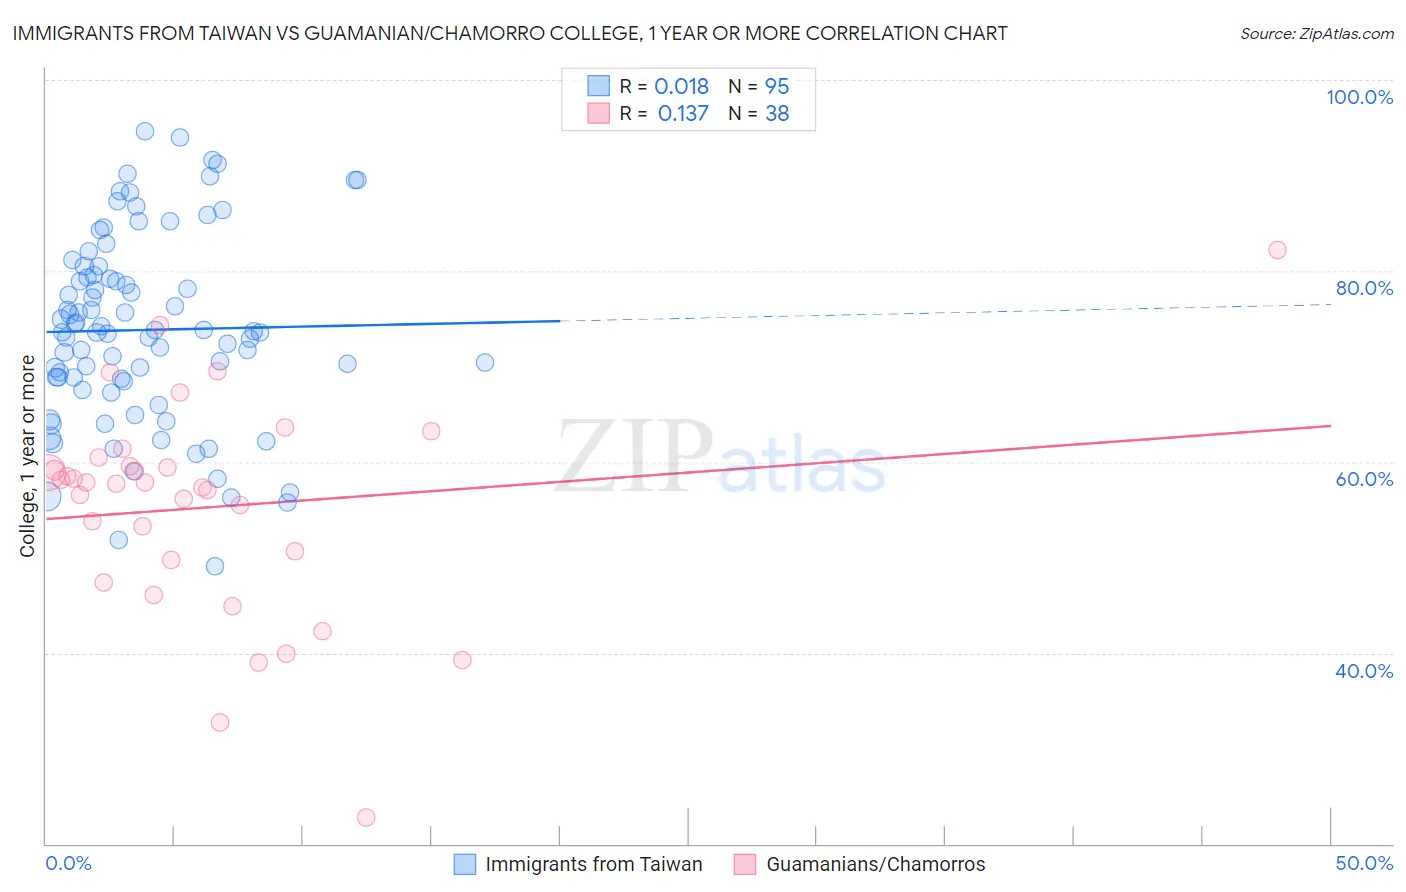
Immigrants from Taiwan vs Guamanian/Chamorro College, 1 year or more Correlation Chart
The statistical analysis conducted on geographies consisting of 298,289,229 people shows no correlation between the proportion of Immigrants from Taiwan and percentage of population with at least college, 1 year or more education in the United States with a correlation coefficient (R) of 0.018 and weighted average of 69.6%. Similarly, the statistical analysis conducted on geographies consisting of 221,965,751 people shows a poor positive correlation between the proportion of Guamanians/Chamorros and percentage of population with at least college, 1 year or more education in the United States with a correlation coefficient (R) of 0.137 and weighted average of 58.6%, a difference of 18.9%.
College, 1 year or more Correlation Summary
| Measurement | Immigrants from Taiwan | Guamanian/Chamorro |
| Minimum | 49.1% | 22.8% |
| Maximum | 94.6% | 82.3% |
| Range | 45.6% | 59.5% |
| Mean | 73.8% | 55.2% |
| Median | 73.6% | 57.7% |
| Interquartile 25% (IQ1) | 68.5% | 49.7% |
| Interquartile 75% (IQ3) | 79.5% | 59.5% |
| Interquartile Range (IQR) | 11.1% | 9.9% |
| Standard Deviation (Sample) | 9.9% | 11.3% |
| Standard Deviation (Population) | 9.9% | 11.2% |
Similar Demographics by College, 1 year or more
Demographics Similar to Immigrants from Taiwan by College, 1 year or more
In terms of college, 1 year or more, the demographic groups most similar to Immigrants from Taiwan are Immigrants from India (69.6%, a difference of 0.0%), Immigrants from Iran (69.5%, a difference of 0.20%), Iranian (70.0%, a difference of 0.49%), Immigrants from Singapore (70.1%, a difference of 0.72%), and Okinawan (69.0%, a difference of 0.97%).
| Demographics | Rating | Rank | College, 1 year or more |
| Filipinos | 100.0 /100 | #1 | Exceptional 71.0% |
| Immigrants | Singapore | 100.0 /100 | #2 | Exceptional 70.1% |
| Iranians | 100.0 /100 | #3 | Exceptional 70.0% |
| Immigrants | Taiwan | 100.0 /100 | #4 | Exceptional 69.6% |
| Immigrants | India | 100.0 /100 | #5 | Exceptional 69.6% |
| Immigrants | Iran | 100.0 /100 | #6 | Exceptional 69.5% |
| Okinawans | 100.0 /100 | #7 | Exceptional 69.0% |
| Thais | 100.0 /100 | #8 | Exceptional 68.6% |
| Immigrants | Israel | 100.0 /100 | #9 | Exceptional 67.8% |
| Immigrants | Australia | 100.0 /100 | #10 | Exceptional 67.7% |
| Immigrants | South Central Asia | 100.0 /100 | #11 | Exceptional 67.1% |
| Cypriots | 100.0 /100 | #12 | Exceptional 67.0% |
| Immigrants | Sweden | 100.0 /100 | #13 | Exceptional 66.8% |
| Burmese | 100.0 /100 | #14 | Exceptional 66.7% |
| Cambodians | 100.0 /100 | #15 | Exceptional 66.7% |
Demographics Similar to Guamanians/Chamorros by College, 1 year or more
In terms of college, 1 year or more, the demographic groups most similar to Guamanians/Chamorros are Dutch (58.6%, a difference of 0.0%), Immigrants from Thailand (58.6%, a difference of 0.010%), Costa Rican (58.6%, a difference of 0.020%), Immigrants from South Eastern Asia (58.5%, a difference of 0.080%), and Peruvian (58.6%, a difference of 0.090%).
| Demographics | Rating | Rank | College, 1 year or more |
| Uruguayans | 31.8 /100 | #189 | Fair 58.8% |
| Immigrants | Cameroon | 31.2 /100 | #190 | Fair 58.8% |
| Immigrants | Philippines | 29.2 /100 | #191 | Fair 58.7% |
| Colombians | 27.6 /100 | #192 | Fair 58.7% |
| Peruvians | 27.5 /100 | #193 | Fair 58.6% |
| Costa Ricans | 26.4 /100 | #194 | Fair 58.6% |
| Dutch | 26.2 /100 | #195 | Fair 58.6% |
| Guamanians/Chamorros | 26.2 /100 | #196 | Fair 58.6% |
| Immigrants | Thailand | 26.0 /100 | #197 | Fair 58.6% |
| Immigrants | South Eastern Asia | 25.1 /100 | #198 | Fair 58.5% |
| Slovaks | 24.6 /100 | #199 | Fair 58.5% |
| Spanish | 24.2 /100 | #200 | Fair 58.5% |
| Nigerians | 23.0 /100 | #201 | Fair 58.5% |
| Immigrants | South America | 21.9 /100 | #202 | Fair 58.4% |
| Ghanaians | 20.9 /100 | #203 | Fair 58.4% |