Cape Verdean vs Guamanian/Chamorro College, 1 year or more
COMPARE
Cape Verdean
Guamanian/Chamorro
College, 1 year or more
College, 1 year or more Comparison
Cape Verdeans
Guamanians/Chamorros
50.3%
COLLEGE, 1 YEAR OR MORE
0.0/ 100
METRIC RATING
329th/ 347
METRIC RANK
58.6%
COLLEGE, 1 YEAR OR MORE
26.2/ 100
METRIC RATING
196th/ 347
METRIC RANK
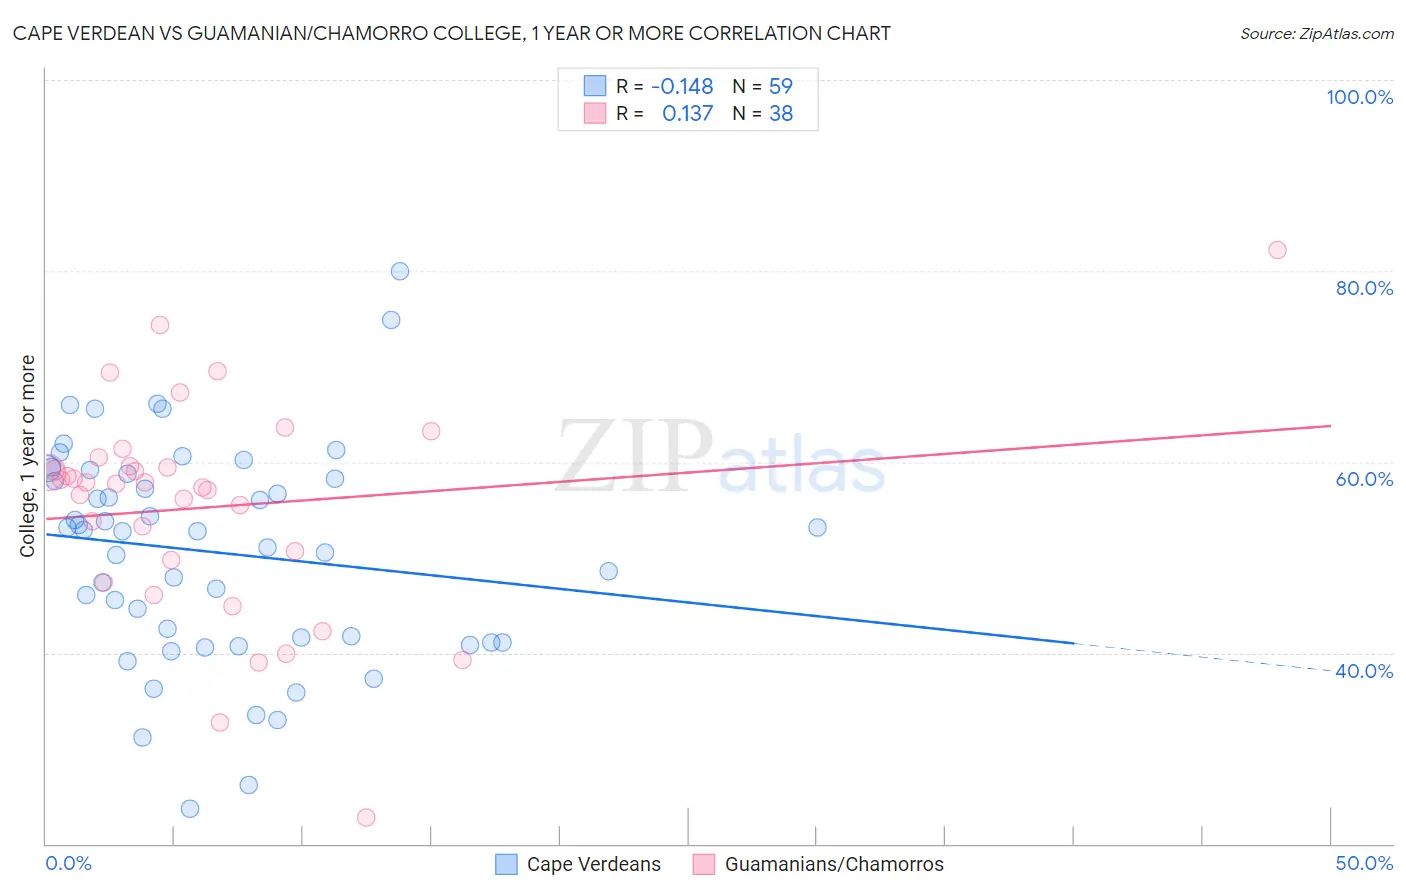
Cape Verdean vs Guamanian/Chamorro College, 1 year or more Correlation Chart
The statistical analysis conducted on geographies consisting of 107,580,652 people shows a poor negative correlation between the proportion of Cape Verdeans and percentage of population with at least college, 1 year or more education in the United States with a correlation coefficient (R) of -0.148 and weighted average of 50.3%. Similarly, the statistical analysis conducted on geographies consisting of 221,965,751 people shows a poor positive correlation between the proportion of Guamanians/Chamorros and percentage of population with at least college, 1 year or more education in the United States with a correlation coefficient (R) of 0.137 and weighted average of 58.6%, a difference of 16.5%.
College, 1 year or more Correlation Summary
| Measurement | Cape Verdean | Guamanian/Chamorro |
| Minimum | 23.7% | 22.8% |
| Maximum | 79.9% | 82.3% |
| Range | 56.2% | 59.5% |
| Mean | 50.6% | 55.2% |
| Median | 52.7% | 57.7% |
| Interquartile 25% (IQ1) | 41.1% | 49.7% |
| Interquartile 75% (IQ3) | 58.8% | 59.5% |
| Interquartile Range (IQR) | 17.7% | 9.9% |
| Standard Deviation (Sample) | 11.4% | 11.3% |
| Standard Deviation (Population) | 11.3% | 11.2% |
Similar Demographics by College, 1 year or more
Demographics Similar to Cape Verdeans by College, 1 year or more
In terms of college, 1 year or more, the demographic groups most similar to Cape Verdeans are Native/Alaskan (50.2%, a difference of 0.22%), Dutch West Indian (50.5%, a difference of 0.39%), Menominee (50.6%, a difference of 0.51%), Dominican (50.6%, a difference of 0.55%), and Immigrants from Yemen (50.0%, a difference of 0.57%).
| Demographics | Rating | Rank | College, 1 year or more |
| Navajo | 0.0 /100 | #322 | Tragic 50.8% |
| Immigrants | Guatemala | 0.0 /100 | #323 | Tragic 50.7% |
| Immigrants | Cuba | 0.0 /100 | #324 | Tragic 50.7% |
| Immigrants | Latin America | 0.0 /100 | #325 | Tragic 50.7% |
| Dominicans | 0.0 /100 | #326 | Tragic 50.6% |
| Menominee | 0.0 /100 | #327 | Tragic 50.6% |
| Dutch West Indians | 0.0 /100 | #328 | Tragic 50.5% |
| Cape Verdeans | 0.0 /100 | #329 | Tragic 50.3% |
| Natives/Alaskans | 0.0 /100 | #330 | Tragic 50.2% |
| Immigrants | Yemen | 0.0 /100 | #331 | Tragic 50.0% |
| Mexicans | 0.0 /100 | #332 | Tragic 49.2% |
| Immigrants | Dominican Republic | 0.0 /100 | #333 | Tragic 49.1% |
| Lumbee | 0.0 /100 | #334 | Tragic 48.9% |
| Yuman | 0.0 /100 | #335 | Tragic 48.7% |
| Spanish American Indians | 0.0 /100 | #336 | Tragic 48.5% |
Demographics Similar to Guamanians/Chamorros by College, 1 year or more
In terms of college, 1 year or more, the demographic groups most similar to Guamanians/Chamorros are Dutch (58.6%, a difference of 0.0%), Immigrants from Thailand (58.6%, a difference of 0.010%), Costa Rican (58.6%, a difference of 0.020%), Immigrants from South Eastern Asia (58.5%, a difference of 0.080%), and Peruvian (58.6%, a difference of 0.090%).
| Demographics | Rating | Rank | College, 1 year or more |
| Uruguayans | 31.8 /100 | #189 | Fair 58.8% |
| Immigrants | Cameroon | 31.2 /100 | #190 | Fair 58.8% |
| Immigrants | Philippines | 29.2 /100 | #191 | Fair 58.7% |
| Colombians | 27.6 /100 | #192 | Fair 58.7% |
| Peruvians | 27.5 /100 | #193 | Fair 58.6% |
| Costa Ricans | 26.4 /100 | #194 | Fair 58.6% |
| Dutch | 26.2 /100 | #195 | Fair 58.6% |
| Guamanians/Chamorros | 26.2 /100 | #196 | Fair 58.6% |
| Immigrants | Thailand | 26.0 /100 | #197 | Fair 58.6% |
| Immigrants | South Eastern Asia | 25.1 /100 | #198 | Fair 58.5% |
| Slovaks | 24.6 /100 | #199 | Fair 58.5% |
| Spanish | 24.2 /100 | #200 | Fair 58.5% |
| Nigerians | 23.0 /100 | #201 | Fair 58.5% |
| Immigrants | South America | 21.9 /100 | #202 | Fair 58.4% |
| Ghanaians | 20.9 /100 | #203 | Fair 58.4% |