Guyanese vs Asian College, 1 year or more
COMPARE
Guyanese
Asian
College, 1 year or more
College, 1 year or more Comparison
Guyanese
Asians
54.1%
COLLEGE, 1 YEAR OR MORE
0.1/ 100
METRIC RATING
282nd/ 347
METRIC RANK
64.2%
COLLEGE, 1 YEAR OR MORE
99.8/ 100
METRIC RATING
53rd/ 347
METRIC RANK
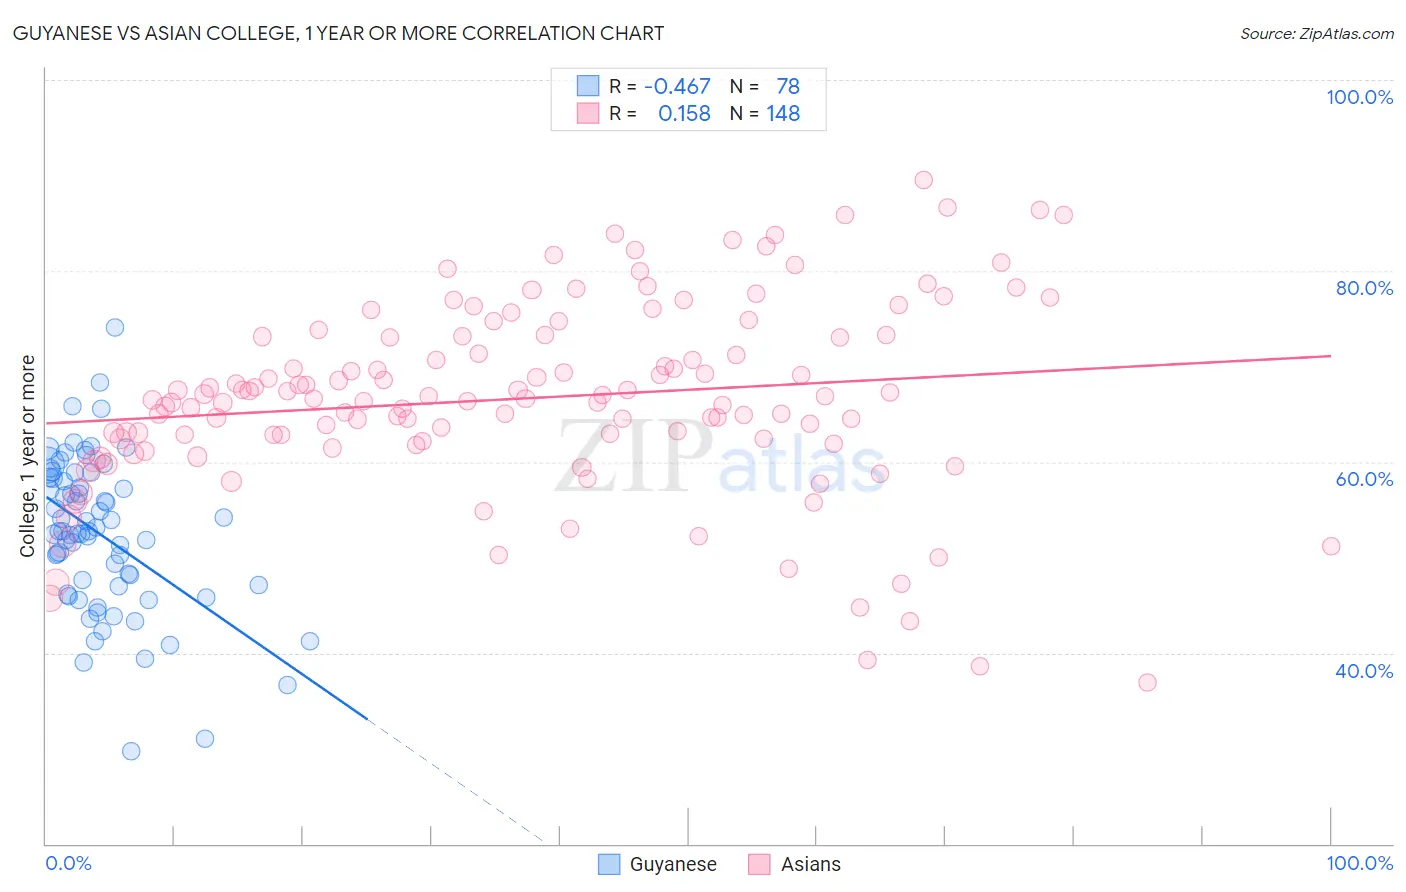
Guyanese vs Asian College, 1 year or more Correlation Chart
The statistical analysis conducted on geographies consisting of 176,939,437 people shows a moderate negative correlation between the proportion of Guyanese and percentage of population with at least college, 1 year or more education in the United States with a correlation coefficient (R) of -0.467 and weighted average of 54.1%. Similarly, the statistical analysis conducted on geographies consisting of 550,911,104 people shows a poor positive correlation between the proportion of Asians and percentage of population with at least college, 1 year or more education in the United States with a correlation coefficient (R) of 0.158 and weighted average of 64.2%, a difference of 18.7%.
College, 1 year or more Correlation Summary
| Measurement | Guyanese | Asian |
| Minimum | 29.6% | 36.8% |
| Maximum | 74.1% | 89.5% |
| Range | 44.4% | 52.7% |
| Mean | 52.4% | 66.7% |
| Median | 52.7% | 66.6% |
| Interquartile 25% (IQ1) | 47.0% | 62.3% |
| Interquartile 75% (IQ3) | 58.3% | 73.1% |
| Interquartile Range (IQR) | 11.3% | 10.9% |
| Standard Deviation (Sample) | 8.1% | 10.0% |
| Standard Deviation (Population) | 8.0% | 10.0% |
Similar Demographics by College, 1 year or more
Demographics Similar to Guyanese by College, 1 year or more
In terms of college, 1 year or more, the demographic groups most similar to Guyanese are Colville (54.1%, a difference of 0.040%), Cheyenne (54.1%, a difference of 0.050%), Arapaho (54.1%, a difference of 0.11%), Immigrants from Jamaica (54.2%, a difference of 0.13%), and Nicaraguan (53.9%, a difference of 0.36%).
| Demographics | Rating | Rank | College, 1 year or more |
| Americans | 0.2 /100 | #275 | Tragic 54.4% |
| Shoshone | 0.2 /100 | #276 | Tragic 54.3% |
| Ecuadorians | 0.2 /100 | #277 | Tragic 54.3% |
| Immigrants | Jamaica | 0.1 /100 | #278 | Tragic 54.2% |
| Arapaho | 0.1 /100 | #279 | Tragic 54.1% |
| Cheyenne | 0.1 /100 | #280 | Tragic 54.1% |
| Colville | 0.1 /100 | #281 | Tragic 54.1% |
| Guyanese | 0.1 /100 | #282 | Tragic 54.1% |
| Nicaraguans | 0.1 /100 | #283 | Tragic 53.9% |
| Ute | 0.1 /100 | #284 | Tragic 53.8% |
| Immigrants | Guyana | 0.1 /100 | #285 | Tragic 53.5% |
| Central American Indians | 0.1 /100 | #286 | Tragic 53.5% |
| Immigrants | Belize | 0.1 /100 | #287 | Tragic 53.5% |
| Alaska Natives | 0.0 /100 | #288 | Tragic 53.4% |
| Immigrants | Ecuador | 0.0 /100 | #289 | Tragic 53.4% |
Demographics Similar to Asians by College, 1 year or more
In terms of college, 1 year or more, the demographic groups most similar to Asians are Immigrants from Netherlands (64.2%, a difference of 0.020%), Zimbabwean (64.2%, a difference of 0.030%), Immigrants from Belarus (64.1%, a difference of 0.15%), Immigrants from Czechoslovakia (64.1%, a difference of 0.17%), and Immigrants from Malaysia (64.3%, a difference of 0.18%).
| Demographics | Rating | Rank | College, 1 year or more |
| Bhutanese | 99.9 /100 | #46 | Exceptional 64.6% |
| Australians | 99.9 /100 | #47 | Exceptional 64.6% |
| Immigrants | Bulgaria | 99.9 /100 | #48 | Exceptional 64.6% |
| New Zealanders | 99.9 /100 | #49 | Exceptional 64.6% |
| Immigrants | Austria | 99.8 /100 | #50 | Exceptional 64.4% |
| Immigrants | Malaysia | 99.8 /100 | #51 | Exceptional 64.3% |
| Immigrants | Netherlands | 99.8 /100 | #52 | Exceptional 64.2% |
| Asians | 99.8 /100 | #53 | Exceptional 64.2% |
| Zimbabweans | 99.8 /100 | #54 | Exceptional 64.2% |
| Immigrants | Belarus | 99.7 /100 | #55 | Exceptional 64.1% |
| Immigrants | Czechoslovakia | 99.7 /100 | #56 | Exceptional 64.1% |
| South Africans | 99.7 /100 | #57 | Exceptional 64.1% |
| Immigrants | Asia | 99.7 /100 | #58 | Exceptional 64.0% |
| Immigrants | Serbia | 99.6 /100 | #59 | Exceptional 63.8% |
| Immigrants | Kazakhstan | 99.5 /100 | #60 | Exceptional 63.6% |