Guyanese vs Guamanian/Chamorro GED/Equivalency
COMPARE
Guyanese
Guamanian/Chamorro
GED/Equivalency
GED/Equivalency Comparison
Guyanese
Guamanians/Chamorros
81.3%
GED/EQUIVALENCY
0.0/ 100
METRIC RATING
306th/ 347
METRIC RANK
85.3%
GED/EQUIVALENCY
28.4/ 100
METRIC RATING
189th/ 347
METRIC RANK
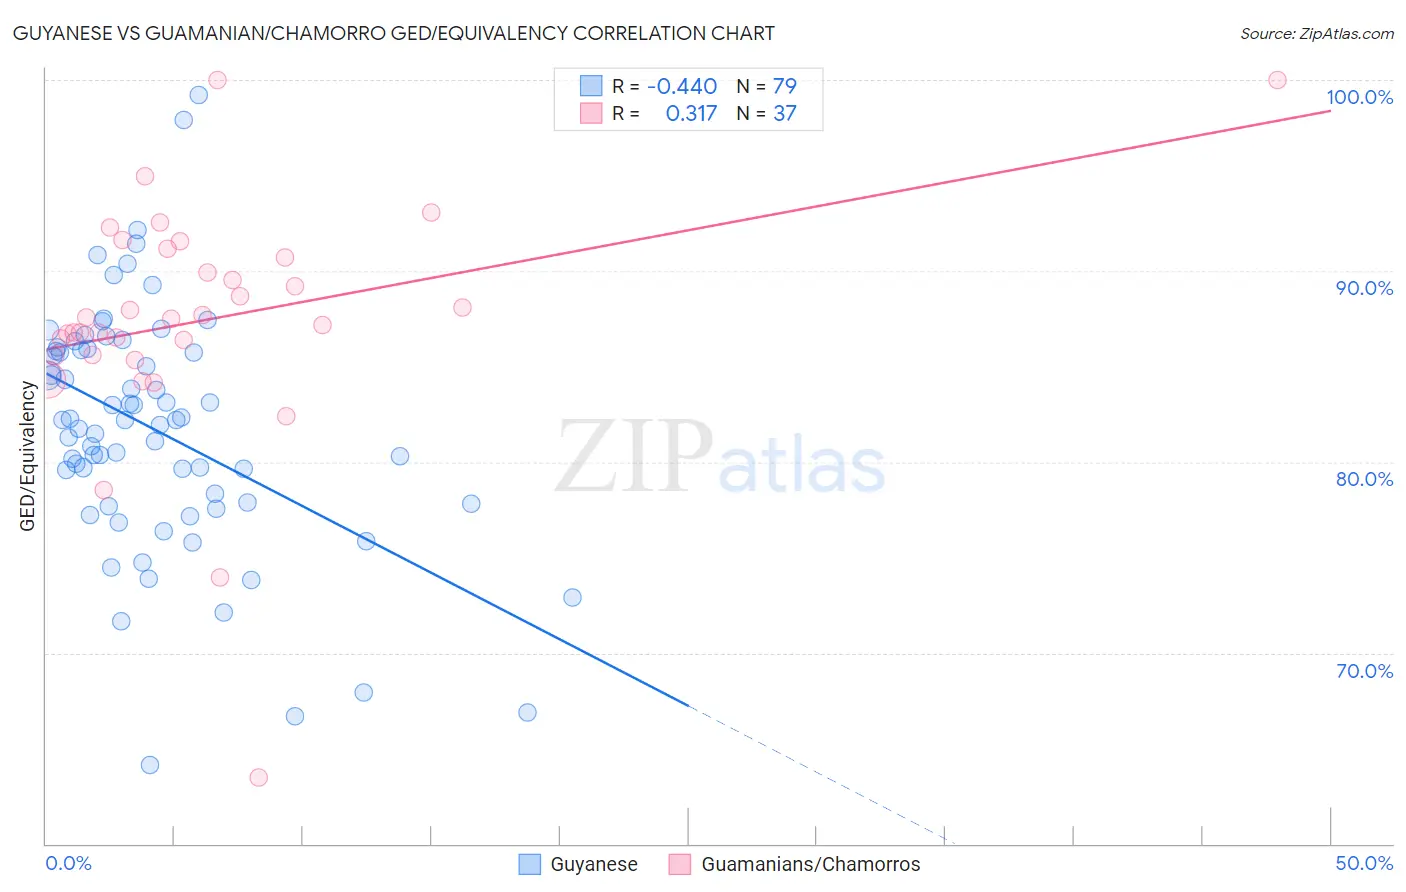
Guyanese vs Guamanian/Chamorro GED/Equivalency Correlation Chart
The statistical analysis conducted on geographies consisting of 176,940,942 people shows a moderate negative correlation between the proportion of Guyanese and percentage of population with at least ged/equivalency education in the United States with a correlation coefficient (R) of -0.440 and weighted average of 81.3%. Similarly, the statistical analysis conducted on geographies consisting of 221,965,618 people shows a mild positive correlation between the proportion of Guamanians/Chamorros and percentage of population with at least ged/equivalency education in the United States with a correlation coefficient (R) of 0.317 and weighted average of 85.3%, a difference of 5.0%.
GED/Equivalency Correlation Summary
| Measurement | Guyanese | Guamanian/Chamorro |
| Minimum | 64.1% | 63.5% |
| Maximum | 99.2% | 100.0% |
| Range | 35.1% | 36.5% |
| Mean | 81.7% | 87.4% |
| Median | 82.2% | 87.5% |
| Interquartile 25% (IQ1) | 77.8% | 85.6% |
| Interquartile 75% (IQ3) | 85.9% | 90.9% |
| Interquartile Range (IQR) | 8.1% | 5.3% |
| Standard Deviation (Sample) | 6.4% | 6.3% |
| Standard Deviation (Population) | 6.3% | 6.2% |
Similar Demographics by GED/Equivalency
Demographics Similar to Guyanese by GED/Equivalency
In terms of ged/equivalency, the demographic groups most similar to Guyanese are Immigrants from Grenada (81.3%, a difference of 0.020%), Immigrants from Dominica (81.1%, a difference of 0.17%), Navajo (81.5%, a difference of 0.23%), Puerto Rican (81.1%, a difference of 0.28%), and Immigrants from Haiti (81.6%, a difference of 0.33%).
| Demographics | Rating | Rank | GED/Equivalency |
| Ecuadorians | 0.0 /100 | #299 | Tragic 81.7% |
| Fijians | 0.0 /100 | #300 | Tragic 81.6% |
| Dutch West Indians | 0.0 /100 | #301 | Tragic 81.6% |
| Immigrants | Haiti | 0.0 /100 | #302 | Tragic 81.6% |
| Immigrants | Portugal | 0.0 /100 | #303 | Tragic 81.6% |
| Navajo | 0.0 /100 | #304 | Tragic 81.5% |
| Immigrants | Grenada | 0.0 /100 | #305 | Tragic 81.3% |
| Guyanese | 0.0 /100 | #306 | Tragic 81.3% |
| Immigrants | Dominica | 0.0 /100 | #307 | Tragic 81.1% |
| Puerto Ricans | 0.0 /100 | #308 | Tragic 81.1% |
| Immigrants | Ecuador | 0.0 /100 | #309 | Tragic 81.0% |
| Immigrants | Guyana | 0.0 /100 | #310 | Tragic 81.0% |
| Natives/Alaskans | 0.0 /100 | #311 | Tragic 80.9% |
| Nicaraguans | 0.0 /100 | #312 | Tragic 80.9% |
| Cape Verdeans | 0.0 /100 | #313 | Tragic 80.9% |
Demographics Similar to Guamanians/Chamorros by GED/Equivalency
In terms of ged/equivalency, the demographic groups most similar to Guamanians/Chamorros are Immigrants from Sierra Leone (85.4%, a difference of 0.010%), Alaskan Athabascan (85.3%, a difference of 0.020%), Immigrants from Afghanistan (85.4%, a difference of 0.030%), Spaniard (85.4%, a difference of 0.090%), and Spanish (85.4%, a difference of 0.11%).
| Demographics | Rating | Rank | GED/Equivalency |
| Sudanese | 35.2 /100 | #182 | Fair 85.5% |
| Immigrants | Sudan | 34.2 /100 | #183 | Fair 85.5% |
| Immigrants | Oceania | 33.6 /100 | #184 | Fair 85.5% |
| Spanish | 32.8 /100 | #185 | Fair 85.4% |
| Spaniards | 31.9 /100 | #186 | Fair 85.4% |
| Immigrants | Afghanistan | 29.8 /100 | #187 | Fair 85.4% |
| Immigrants | Sierra Leone | 29.0 /100 | #188 | Fair 85.4% |
| Guamanians/Chamorros | 28.4 /100 | #189 | Fair 85.3% |
| Alaskan Athabascans | 27.5 /100 | #190 | Fair 85.3% |
| South American Indians | 22.8 /100 | #191 | Fair 85.2% |
| Immigrants | Nonimmigrants | 22.7 /100 | #192 | Fair 85.2% |
| Delaware | 22.2 /100 | #193 | Fair 85.2% |
| Puget Sound Salish | 20.8 /100 | #194 | Fair 85.2% |
| Chippewa | 20.8 /100 | #195 | Fair 85.2% |
| Tongans | 20.7 /100 | #196 | Fair 85.2% |