Immigrants from Norway vs Guamanian/Chamorro College, 1 year or more
COMPARE
Immigrants from Norway
Guamanian/Chamorro
College, 1 year or more
College, 1 year or more Comparison
Immigrants from Norway
Guamanians/Chamorros
64.7%
COLLEGE, 1 YEAR OR MORE
99.9/ 100
METRIC RATING
44th/ 347
METRIC RANK
58.6%
COLLEGE, 1 YEAR OR MORE
26.2/ 100
METRIC RATING
196th/ 347
METRIC RANK
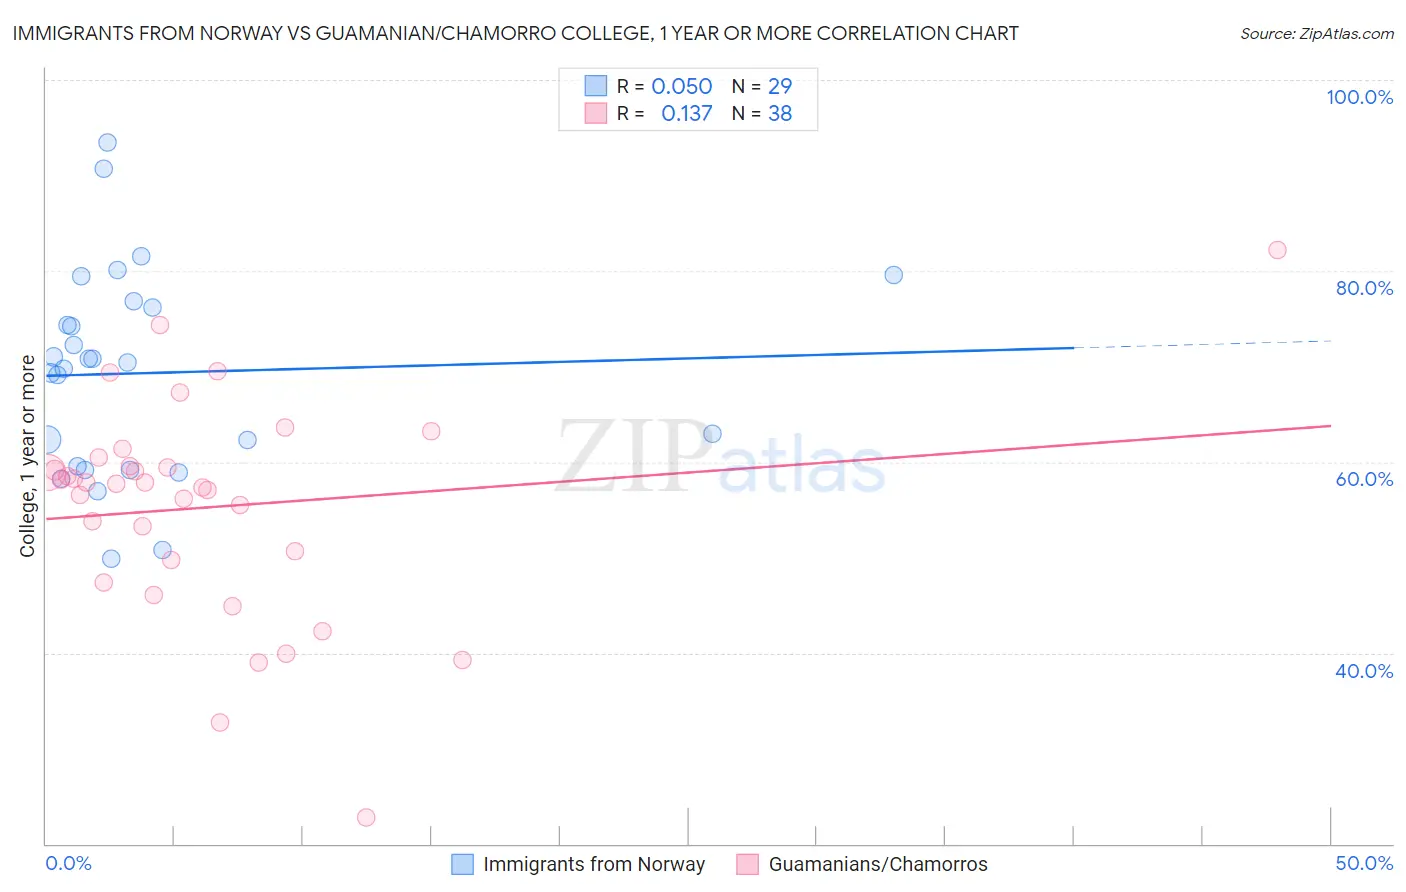
Immigrants from Norway vs Guamanian/Chamorro College, 1 year or more Correlation Chart
The statistical analysis conducted on geographies consisting of 116,716,420 people shows no correlation between the proportion of Immigrants from Norway and percentage of population with at least college, 1 year or more education in the United States with a correlation coefficient (R) of 0.050 and weighted average of 64.7%. Similarly, the statistical analysis conducted on geographies consisting of 221,965,751 people shows a poor positive correlation between the proportion of Guamanians/Chamorros and percentage of population with at least college, 1 year or more education in the United States with a correlation coefficient (R) of 0.137 and weighted average of 58.6%, a difference of 10.5%.
College, 1 year or more Correlation Summary
| Measurement | Immigrants from Norway | Guamanian/Chamorro |
| Minimum | 49.9% | 22.8% |
| Maximum | 93.5% | 82.3% |
| Range | 43.6% | 59.5% |
| Mean | 69.3% | 55.2% |
| Median | 70.3% | 57.7% |
| Interquartile 25% (IQ1) | 59.4% | 49.7% |
| Interquartile 75% (IQ3) | 76.5% | 59.5% |
| Interquartile Range (IQR) | 17.1% | 9.9% |
| Standard Deviation (Sample) | 10.7% | 11.3% |
| Standard Deviation (Population) | 10.6% | 11.2% |
Similar Demographics by College, 1 year or more
Demographics Similar to Immigrants from Norway by College, 1 year or more
In terms of college, 1 year or more, the demographic groups most similar to Immigrants from Norway are Immigrants from Russia (64.7%, a difference of 0.020%), Immigrants from Latvia (64.8%, a difference of 0.14%), Mongolian (64.8%, a difference of 0.15%), Immigrants from Lithuania (64.6%, a difference of 0.17%), and Bhutanese (64.6%, a difference of 0.18%).
| Demographics | Rating | Rank | College, 1 year or more |
| Russians | 99.9 /100 | #37 | Exceptional 65.1% |
| Immigrants | Saudi Arabia | 99.9 /100 | #38 | Exceptional 65.0% |
| Estonians | 99.9 /100 | #39 | Exceptional 65.0% |
| Immigrants | Kuwait | 99.9 /100 | #40 | Exceptional 65.0% |
| Mongolians | 99.9 /100 | #41 | Exceptional 64.8% |
| Immigrants | Latvia | 99.9 /100 | #42 | Exceptional 64.8% |
| Immigrants | Russia | 99.9 /100 | #43 | Exceptional 64.7% |
| Immigrants | Norway | 99.9 /100 | #44 | Exceptional 64.7% |
| Immigrants | Lithuania | 99.9 /100 | #45 | Exceptional 64.6% |
| Bhutanese | 99.9 /100 | #46 | Exceptional 64.6% |
| Australians | 99.9 /100 | #47 | Exceptional 64.6% |
| Immigrants | Bulgaria | 99.9 /100 | #48 | Exceptional 64.6% |
| New Zealanders | 99.9 /100 | #49 | Exceptional 64.6% |
| Immigrants | Austria | 99.8 /100 | #50 | Exceptional 64.4% |
| Immigrants | Malaysia | 99.8 /100 | #51 | Exceptional 64.3% |
Demographics Similar to Guamanians/Chamorros by College, 1 year or more
In terms of college, 1 year or more, the demographic groups most similar to Guamanians/Chamorros are Dutch (58.6%, a difference of 0.0%), Immigrants from Thailand (58.6%, a difference of 0.010%), Costa Rican (58.6%, a difference of 0.020%), Immigrants from South Eastern Asia (58.5%, a difference of 0.080%), and Peruvian (58.6%, a difference of 0.090%).
| Demographics | Rating | Rank | College, 1 year or more |
| Uruguayans | 31.8 /100 | #189 | Fair 58.8% |
| Immigrants | Cameroon | 31.2 /100 | #190 | Fair 58.8% |
| Immigrants | Philippines | 29.2 /100 | #191 | Fair 58.7% |
| Colombians | 27.6 /100 | #192 | Fair 58.7% |
| Peruvians | 27.5 /100 | #193 | Fair 58.6% |
| Costa Ricans | 26.4 /100 | #194 | Fair 58.6% |
| Dutch | 26.2 /100 | #195 | Fair 58.6% |
| Guamanians/Chamorros | 26.2 /100 | #196 | Fair 58.6% |
| Immigrants | Thailand | 26.0 /100 | #197 | Fair 58.6% |
| Immigrants | South Eastern Asia | 25.1 /100 | #198 | Fair 58.5% |
| Slovaks | 24.6 /100 | #199 | Fair 58.5% |
| Spanish | 24.2 /100 | #200 | Fair 58.5% |
| Nigerians | 23.0 /100 | #201 | Fair 58.5% |
| Immigrants | South America | 21.9 /100 | #202 | Fair 58.4% |
| Ghanaians | 20.9 /100 | #203 | Fair 58.4% |