Malaysian vs Guamanian/Chamorro College, 1 year or more
COMPARE
Malaysian
Guamanian/Chamorro
College, 1 year or more
College, 1 year or more Comparison
Malaysians
Guamanians/Chamorros
55.6%
COLLEGE, 1 YEAR OR MORE
0.8/ 100
METRIC RATING
246th/ 347
METRIC RANK
58.6%
COLLEGE, 1 YEAR OR MORE
26.2/ 100
METRIC RATING
196th/ 347
METRIC RANK
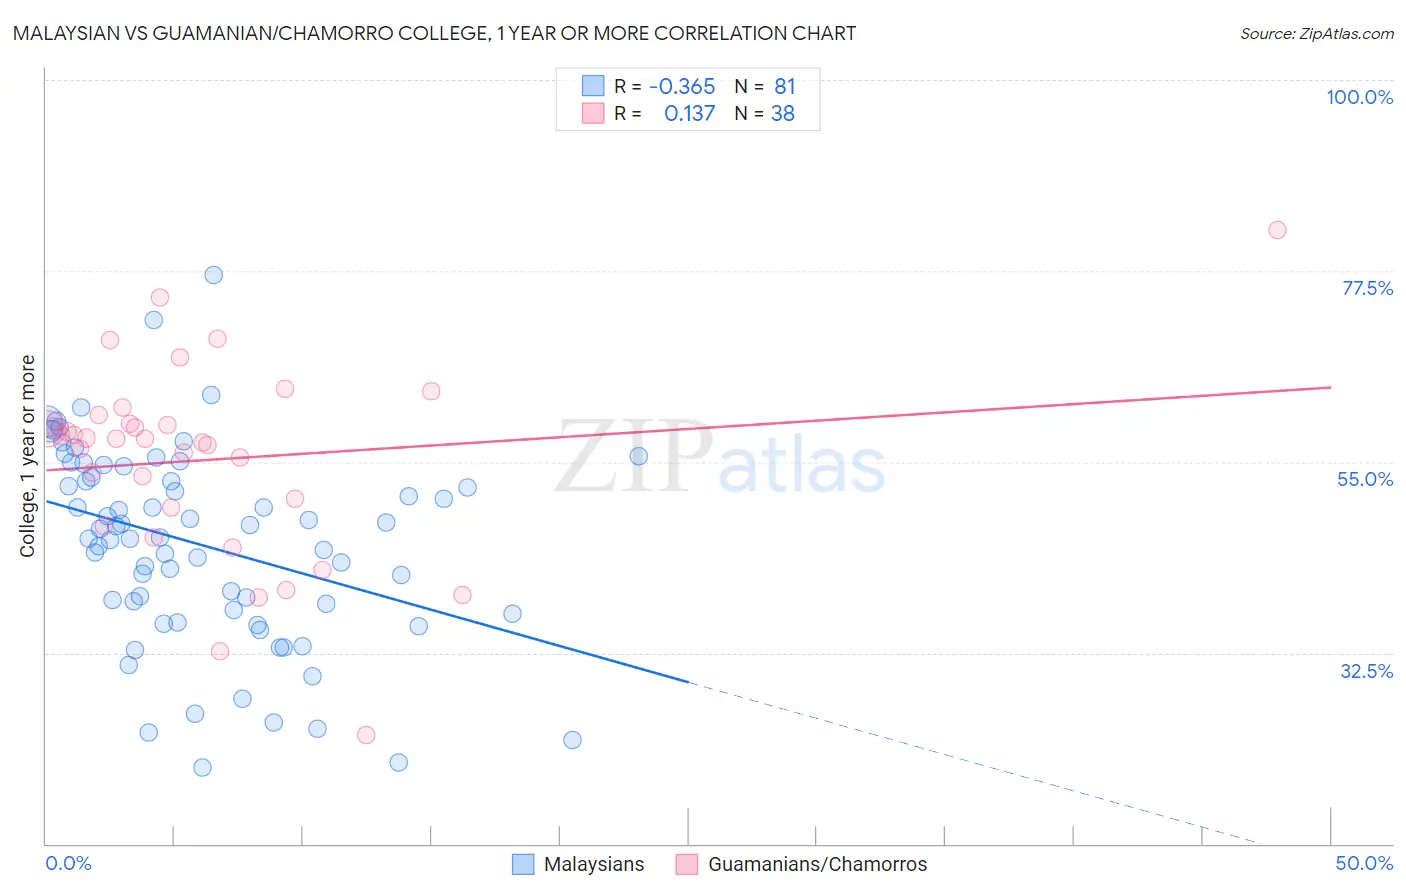
Malaysian vs Guamanian/Chamorro College, 1 year or more Correlation Chart
The statistical analysis conducted on geographies consisting of 226,108,921 people shows a mild negative correlation between the proportion of Malaysians and percentage of population with at least college, 1 year or more education in the United States with a correlation coefficient (R) of -0.365 and weighted average of 55.6%. Similarly, the statistical analysis conducted on geographies consisting of 221,965,751 people shows a poor positive correlation between the proportion of Guamanians/Chamorros and percentage of population with at least college, 1 year or more education in the United States with a correlation coefficient (R) of 0.137 and weighted average of 58.6%, a difference of 5.3%.
College, 1 year or more Correlation Summary
| Measurement | Malaysian | Guamanian/Chamorro |
| Minimum | 19.0% | 22.8% |
| Maximum | 77.1% | 82.3% |
| Range | 58.1% | 59.5% |
| Mean | 45.2% | 55.2% |
| Median | 46.1% | 57.7% |
| Interquartile 25% (IQ1) | 37.3% | 49.7% |
| Interquartile 75% (IQ3) | 53.8% | 59.5% |
| Interquartile Range (IQR) | 16.5% | 9.9% |
| Standard Deviation (Sample) | 11.7% | 11.3% |
| Standard Deviation (Population) | 11.6% | 11.2% |
Similar Demographics by College, 1 year or more
Demographics Similar to Malaysians by College, 1 year or more
In terms of college, 1 year or more, the demographic groups most similar to Malaysians are Immigrants from Liberia (55.7%, a difference of 0.050%), Hawaiian (55.6%, a difference of 0.070%), Chippewa (55.7%, a difference of 0.11%), Immigrants from Congo (55.6%, a difference of 0.11%), and Immigrants from Trinidad and Tobago (55.5%, a difference of 0.21%).
| Demographics | Rating | Rank | College, 1 year or more |
| Puget Sound Salish | 1.1 /100 | #239 | Tragic 55.9% |
| Trinidadians and Tobagonians | 1.1 /100 | #240 | Tragic 55.8% |
| French American Indians | 1.0 /100 | #241 | Tragic 55.8% |
| Marshallese | 1.0 /100 | #242 | Tragic 55.8% |
| Osage | 1.0 /100 | #243 | Tragic 55.8% |
| Chippewa | 0.9 /100 | #244 | Tragic 55.7% |
| Immigrants | Liberia | 0.8 /100 | #245 | Tragic 55.7% |
| Malaysians | 0.8 /100 | #246 | Tragic 55.6% |
| Hawaiians | 0.8 /100 | #247 | Tragic 55.6% |
| Immigrants | Congo | 0.8 /100 | #248 | Tragic 55.6% |
| Immigrants | Trinidad and Tobago | 0.7 /100 | #249 | Tragic 55.5% |
| Delaware | 0.7 /100 | #250 | Tragic 55.5% |
| Immigrants | Cambodia | 0.6 /100 | #251 | Tragic 55.4% |
| Aleuts | 0.6 /100 | #252 | Tragic 55.4% |
| Immigrants | Barbados | 0.6 /100 | #253 | Tragic 55.4% |
Demographics Similar to Guamanians/Chamorros by College, 1 year or more
In terms of college, 1 year or more, the demographic groups most similar to Guamanians/Chamorros are Dutch (58.6%, a difference of 0.0%), Immigrants from Thailand (58.6%, a difference of 0.010%), Costa Rican (58.6%, a difference of 0.020%), Immigrants from South Eastern Asia (58.5%, a difference of 0.080%), and Peruvian (58.6%, a difference of 0.090%).
| Demographics | Rating | Rank | College, 1 year or more |
| Uruguayans | 31.8 /100 | #189 | Fair 58.8% |
| Immigrants | Cameroon | 31.2 /100 | #190 | Fair 58.8% |
| Immigrants | Philippines | 29.2 /100 | #191 | Fair 58.7% |
| Colombians | 27.6 /100 | #192 | Fair 58.7% |
| Peruvians | 27.5 /100 | #193 | Fair 58.6% |
| Costa Ricans | 26.4 /100 | #194 | Fair 58.6% |
| Dutch | 26.2 /100 | #195 | Fair 58.6% |
| Guamanians/Chamorros | 26.2 /100 | #196 | Fair 58.6% |
| Immigrants | Thailand | 26.0 /100 | #197 | Fair 58.6% |
| Immigrants | South Eastern Asia | 25.1 /100 | #198 | Fair 58.5% |
| Slovaks | 24.6 /100 | #199 | Fair 58.5% |
| Spanish | 24.2 /100 | #200 | Fair 58.5% |
| Nigerians | 23.0 /100 | #201 | Fair 58.5% |
| Immigrants | South America | 21.9 /100 | #202 | Fair 58.4% |
| Ghanaians | 20.9 /100 | #203 | Fair 58.4% |