French vs Guamanian/Chamorro College, 1 year or more
COMPARE
French
Guamanian/Chamorro
College, 1 year or more
College, 1 year or more Comparison
French
Guamanians/Chamorros
58.9%
COLLEGE, 1 YEAR OR MORE
34.4/ 100
METRIC RATING
188th/ 347
METRIC RANK
58.6%
COLLEGE, 1 YEAR OR MORE
26.2/ 100
METRIC RATING
196th/ 347
METRIC RANK
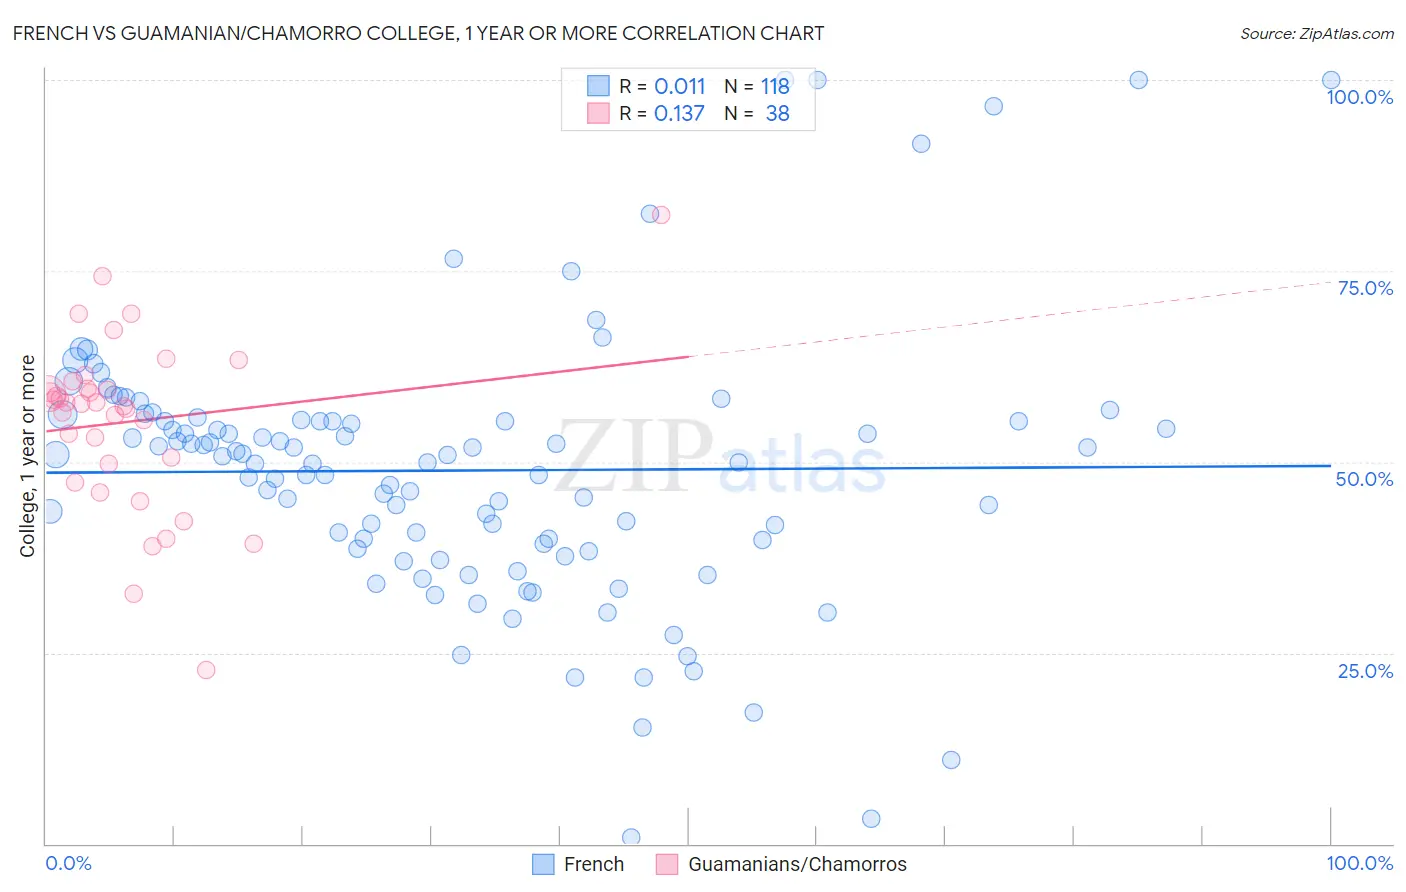
French vs Guamanian/Chamorro College, 1 year or more Correlation Chart
The statistical analysis conducted on geographies consisting of 572,417,926 people shows no correlation between the proportion of French and percentage of population with at least college, 1 year or more education in the United States with a correlation coefficient (R) of 0.011 and weighted average of 58.9%. Similarly, the statistical analysis conducted on geographies consisting of 221,965,751 people shows a poor positive correlation between the proportion of Guamanians/Chamorros and percentage of population with at least college, 1 year or more education in the United States with a correlation coefficient (R) of 0.137 and weighted average of 58.6%, a difference of 0.52%.
College, 1 year or more Correlation Summary
| Measurement | French | Guamanian/Chamorro |
| Minimum | 0.78% | 22.8% |
| Maximum | 100.0% | 82.3% |
| Range | 99.2% | 59.5% |
| Mean | 48.9% | 55.2% |
| Median | 50.4% | 57.7% |
| Interquartile 25% (IQ1) | 39.3% | 49.7% |
| Interquartile 75% (IQ3) | 55.4% | 59.5% |
| Interquartile Range (IQR) | 16.1% | 9.9% |
| Standard Deviation (Sample) | 17.8% | 11.3% |
| Standard Deviation (Population) | 17.7% | 11.2% |
Demographics Similar to French and Guamanians/Chamorros by College, 1 year or more
In terms of college, 1 year or more, the demographic groups most similar to French are Scotch-Irish (58.9%, a difference of 0.020%), German (58.9%, a difference of 0.020%), South American (59.0%, a difference of 0.090%), Uruguayan (58.8%, a difference of 0.15%), and Immigrants from Cameroon (58.8%, a difference of 0.19%). Similarly, the demographic groups most similar to Guamanians/Chamorros are Dutch (58.6%, a difference of 0.0%), Immigrants from Thailand (58.6%, a difference of 0.010%), Costa Rican (58.6%, a difference of 0.020%), Immigrants from South Eastern Asia (58.5%, a difference of 0.080%), and Peruvian (58.6%, a difference of 0.090%).
| Demographics | Rating | Rank | College, 1 year or more |
| Immigrants | Bosnia and Herzegovina | 42.8 /100 | #182 | Average 59.2% |
| German Russians | 39.3 /100 | #183 | Fair 59.1% |
| Spaniards | 38.3 /100 | #184 | Fair 59.0% |
| South Americans | 35.9 /100 | #185 | Fair 59.0% |
| Scotch-Irish | 34.7 /100 | #186 | Fair 58.9% |
| Germans | 34.7 /100 | #187 | Fair 58.9% |
| French | 34.4 /100 | #188 | Fair 58.9% |
| Uruguayans | 31.8 /100 | #189 | Fair 58.8% |
| Immigrants | Cameroon | 31.2 /100 | #190 | Fair 58.8% |
| Immigrants | Philippines | 29.2 /100 | #191 | Fair 58.7% |
| Colombians | 27.6 /100 | #192 | Fair 58.7% |
| Peruvians | 27.5 /100 | #193 | Fair 58.6% |
| Costa Ricans | 26.4 /100 | #194 | Fair 58.6% |
| Dutch | 26.2 /100 | #195 | Fair 58.6% |
| Guamanians/Chamorros | 26.2 /100 | #196 | Fair 58.6% |
| Immigrants | Thailand | 26.0 /100 | #197 | Fair 58.6% |
| Immigrants | South Eastern Asia | 25.1 /100 | #198 | Fair 58.5% |
| Slovaks | 24.6 /100 | #199 | Fair 58.5% |
| Spanish | 24.2 /100 | #200 | Fair 58.5% |
| Nigerians | 23.0 /100 | #201 | Fair 58.5% |
| Immigrants | South America | 21.9 /100 | #202 | Fair 58.4% |