Guyanese vs British West Indian College, 1 year or more
COMPARE
Guyanese
British West Indian
College, 1 year or more
College, 1 year or more Comparison
Guyanese
British West Indians
54.1%
COLLEGE, 1 YEAR OR MORE
0.1/ 100
METRIC RATING
282nd/ 347
METRIC RANK
54.5%
COLLEGE, 1 YEAR OR MORE
0.2/ 100
METRIC RATING
268th/ 347
METRIC RANK
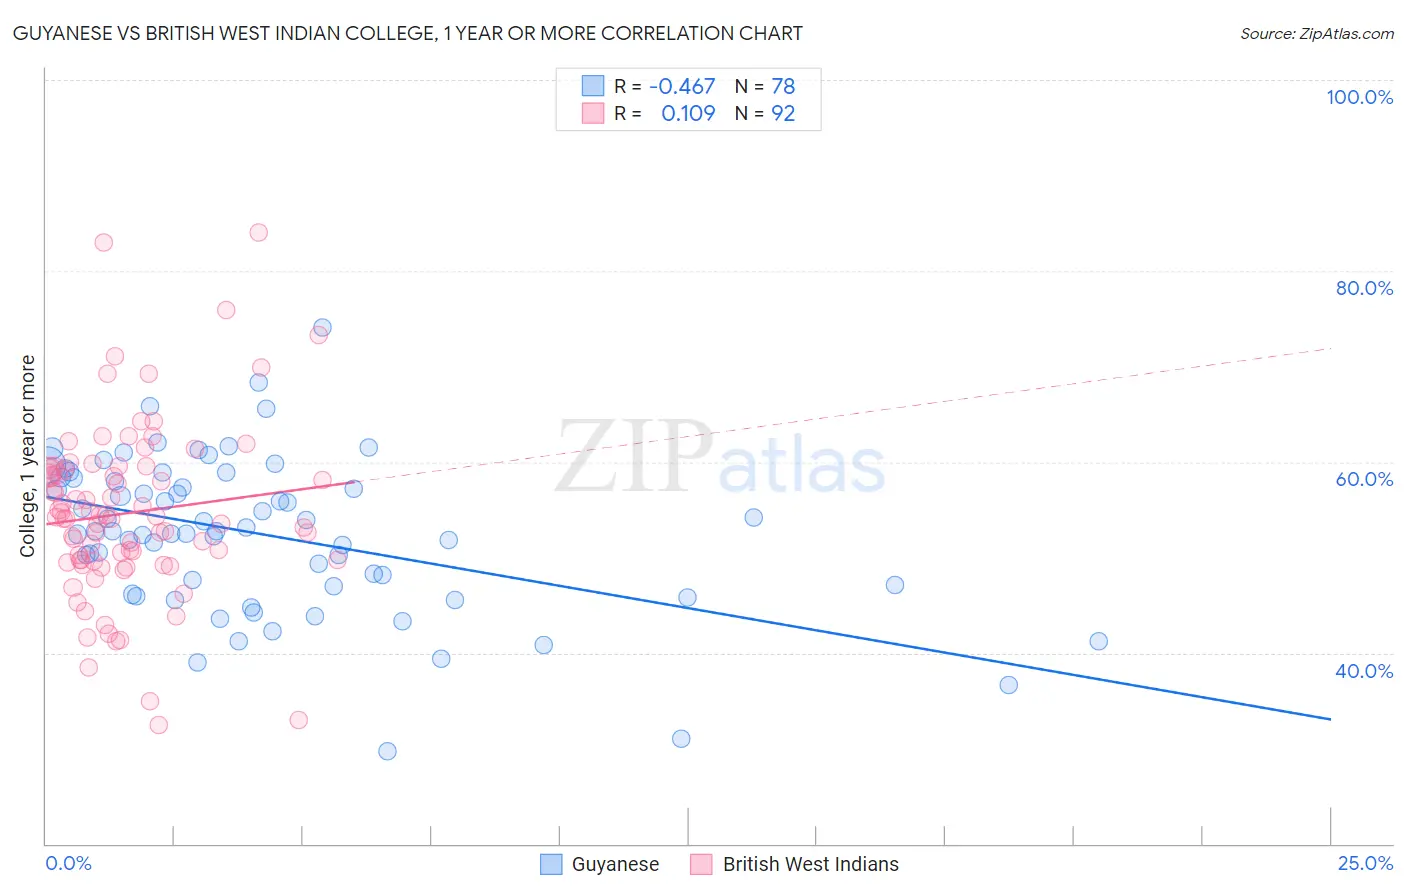
Guyanese vs British West Indian College, 1 year or more Correlation Chart
The statistical analysis conducted on geographies consisting of 176,939,437 people shows a moderate negative correlation between the proportion of Guyanese and percentage of population with at least college, 1 year or more education in the United States with a correlation coefficient (R) of -0.467 and weighted average of 54.1%. Similarly, the statistical analysis conducted on geographies consisting of 152,694,627 people shows a poor positive correlation between the proportion of British West Indians and percentage of population with at least college, 1 year or more education in the United States with a correlation coefficient (R) of 0.109 and weighted average of 54.5%, a difference of 0.81%.
College, 1 year or more Correlation Summary
| Measurement | Guyanese | British West Indian |
| Minimum | 29.6% | 32.4% |
| Maximum | 74.1% | 84.0% |
| Range | 44.4% | 51.6% |
| Mean | 52.4% | 54.6% |
| Median | 52.7% | 54.1% |
| Interquartile 25% (IQ1) | 47.0% | 49.6% |
| Interquartile 75% (IQ3) | 58.3% | 59.2% |
| Interquartile Range (IQR) | 11.3% | 9.6% |
| Standard Deviation (Sample) | 8.1% | 9.2% |
| Standard Deviation (Population) | 8.0% | 9.1% |
Demographics Similar to Guyanese and British West Indians by College, 1 year or more
In terms of college, 1 year or more, the demographic groups most similar to Guyanese are Colville (54.1%, a difference of 0.040%), Cheyenne (54.1%, a difference of 0.050%), Arapaho (54.1%, a difference of 0.11%), Immigrants from Jamaica (54.2%, a difference of 0.13%), and Nicaraguan (53.9%, a difference of 0.36%). Similarly, the demographic groups most similar to British West Indians are Bangladeshi (54.5%, a difference of 0.030%), Crow (54.5%, a difference of 0.070%), Bahamian (54.5%, a difference of 0.090%), Comanche (54.4%, a difference of 0.14%), and Blackfeet (54.6%, a difference of 0.16%).
| Demographics | Rating | Rank | College, 1 year or more |
| Immigrants | Laos | 0.2 /100 | #265 | Tragic 54.7% |
| Potawatomi | 0.2 /100 | #266 | Tragic 54.6% |
| Blackfeet | 0.2 /100 | #267 | Tragic 54.6% |
| British West Indians | 0.2 /100 | #268 | Tragic 54.5% |
| Bangladeshis | 0.2 /100 | #269 | Tragic 54.5% |
| Crow | 0.2 /100 | #270 | Tragic 54.5% |
| Bahamians | 0.2 /100 | #271 | Tragic 54.5% |
| Comanche | 0.2 /100 | #272 | Tragic 54.4% |
| Immigrants | Grenada | 0.2 /100 | #273 | Tragic 54.4% |
| Belizeans | 0.2 /100 | #274 | Tragic 54.4% |
| Americans | 0.2 /100 | #275 | Tragic 54.4% |
| Shoshone | 0.2 /100 | #276 | Tragic 54.3% |
| Ecuadorians | 0.2 /100 | #277 | Tragic 54.3% |
| Immigrants | Jamaica | 0.1 /100 | #278 | Tragic 54.2% |
| Arapaho | 0.1 /100 | #279 | Tragic 54.1% |
| Cheyenne | 0.1 /100 | #280 | Tragic 54.1% |
| Colville | 0.1 /100 | #281 | Tragic 54.1% |
| Guyanese | 0.1 /100 | #282 | Tragic 54.1% |
| Nicaraguans | 0.1 /100 | #283 | Tragic 53.9% |
| Ute | 0.1 /100 | #284 | Tragic 53.8% |
| Immigrants | Guyana | 0.1 /100 | #285 | Tragic 53.5% |