Guyanese vs Afghan College, 1 year or more
COMPARE
Guyanese
Afghan
College, 1 year or more
College, 1 year or more Comparison
Guyanese
Afghans
54.1%
COLLEGE, 1 YEAR OR MORE
0.1/ 100
METRIC RATING
282nd/ 347
METRIC RANK
62.0%
COLLEGE, 1 YEAR OR MORE
96.4/ 100
METRIC RATING
103rd/ 347
METRIC RANK
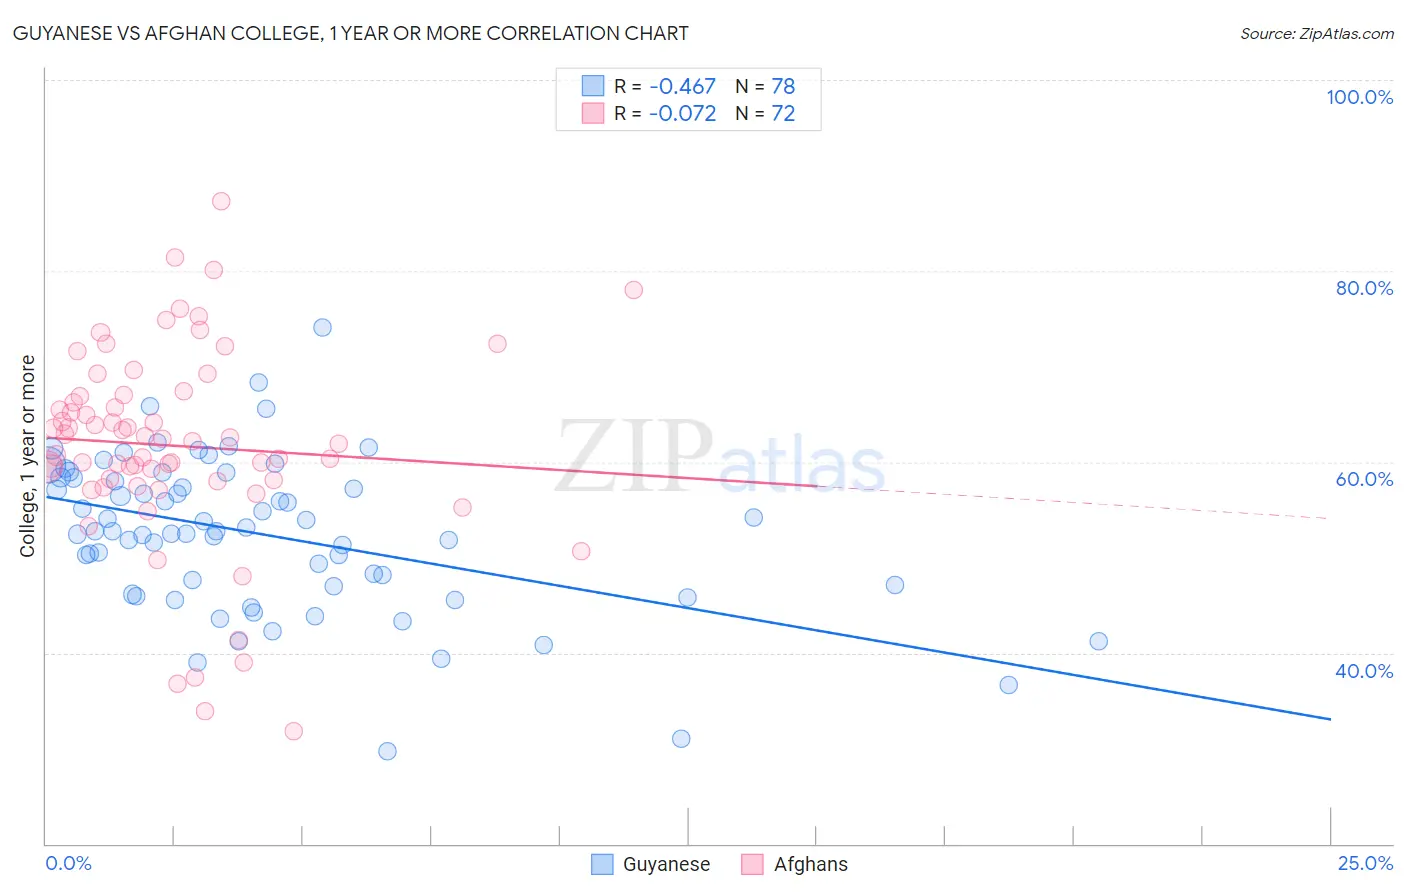
Guyanese vs Afghan College, 1 year or more Correlation Chart
The statistical analysis conducted on geographies consisting of 176,939,437 people shows a moderate negative correlation between the proportion of Guyanese and percentage of population with at least college, 1 year or more education in the United States with a correlation coefficient (R) of -0.467 and weighted average of 54.1%. Similarly, the statistical analysis conducted on geographies consisting of 148,873,328 people shows a slight negative correlation between the proportion of Afghans and percentage of population with at least college, 1 year or more education in the United States with a correlation coefficient (R) of -0.072 and weighted average of 62.0%, a difference of 14.6%.
College, 1 year or more Correlation Summary
| Measurement | Guyanese | Afghan |
| Minimum | 29.6% | 31.8% |
| Maximum | 74.1% | 87.2% |
| Range | 44.4% | 55.4% |
| Mean | 52.4% | 61.7% |
| Median | 52.7% | 62.3% |
| Interquartile 25% (IQ1) | 47.0% | 58.0% |
| Interquartile 75% (IQ3) | 58.3% | 67.0% |
| Interquartile Range (IQR) | 11.3% | 8.9% |
| Standard Deviation (Sample) | 8.1% | 10.6% |
| Standard Deviation (Population) | 8.0% | 10.5% |
Similar Demographics by College, 1 year or more
Demographics Similar to Guyanese by College, 1 year or more
In terms of college, 1 year or more, the demographic groups most similar to Guyanese are Colville (54.1%, a difference of 0.040%), Cheyenne (54.1%, a difference of 0.050%), Arapaho (54.1%, a difference of 0.11%), Immigrants from Jamaica (54.2%, a difference of 0.13%), and Nicaraguan (53.9%, a difference of 0.36%).
| Demographics | Rating | Rank | College, 1 year or more |
| Americans | 0.2 /100 | #275 | Tragic 54.4% |
| Shoshone | 0.2 /100 | #276 | Tragic 54.3% |
| Ecuadorians | 0.2 /100 | #277 | Tragic 54.3% |
| Immigrants | Jamaica | 0.1 /100 | #278 | Tragic 54.2% |
| Arapaho | 0.1 /100 | #279 | Tragic 54.1% |
| Cheyenne | 0.1 /100 | #280 | Tragic 54.1% |
| Colville | 0.1 /100 | #281 | Tragic 54.1% |
| Guyanese | 0.1 /100 | #282 | Tragic 54.1% |
| Nicaraguans | 0.1 /100 | #283 | Tragic 53.9% |
| Ute | 0.1 /100 | #284 | Tragic 53.8% |
| Immigrants | Guyana | 0.1 /100 | #285 | Tragic 53.5% |
| Central American Indians | 0.1 /100 | #286 | Tragic 53.5% |
| Immigrants | Belize | 0.1 /100 | #287 | Tragic 53.5% |
| Alaska Natives | 0.0 /100 | #288 | Tragic 53.4% |
| Immigrants | Ecuador | 0.0 /100 | #289 | Tragic 53.4% |
Demographics Similar to Afghans by College, 1 year or more
In terms of college, 1 year or more, the demographic groups most similar to Afghans are Chilean (62.0%, a difference of 0.010%), Immigrants from Nepal (62.0%, a difference of 0.030%), Palestinian (62.0%, a difference of 0.030%), Luxembourger (62.1%, a difference of 0.12%), and Icelander (62.1%, a difference of 0.13%).
| Demographics | Rating | Rank | College, 1 year or more |
| Chinese | 97.2 /100 | #96 | Exceptional 62.2% |
| Jordanians | 97.2 /100 | #97 | Exceptional 62.2% |
| Carpatho Rusyns | 97.2 /100 | #98 | Exceptional 62.2% |
| Croatians | 97.1 /100 | #99 | Exceptional 62.2% |
| Icelanders | 96.8 /100 | #100 | Exceptional 62.1% |
| Swedes | 96.8 /100 | #101 | Exceptional 62.1% |
| Luxembourgers | 96.7 /100 | #102 | Exceptional 62.1% |
| Afghans | 96.4 /100 | #103 | Exceptional 62.0% |
| Chileans | 96.4 /100 | #104 | Exceptional 62.0% |
| Immigrants | Nepal | 96.3 /100 | #105 | Exceptional 62.0% |
| Palestinians | 96.3 /100 | #106 | Exceptional 62.0% |
| Immigrants | Ukraine | 95.8 /100 | #107 | Exceptional 61.9% |
| Syrians | 95.7 /100 | #108 | Exceptional 61.9% |
| Immigrants | Northern Africa | 95.7 /100 | #109 | Exceptional 61.9% |
| Europeans | 95.6 /100 | #110 | Exceptional 61.8% |