Guamanian/Chamorro vs Tsimshian 12th Grade, No Diploma
COMPARE
Guamanian/Chamorro
Tsimshian
12th Grade, No Diploma
12th Grade, No Diploma Comparison
Guamanians/Chamorros
Tsimshian
91.0%
12TH GRADE, NO DIPLOMA
39.5/ 100
METRIC RATING
181st/ 347
METRIC RANK
92.9%
12TH GRADE, NO DIPLOMA
99.8/ 100
METRIC RATING
50th/ 347
METRIC RANK
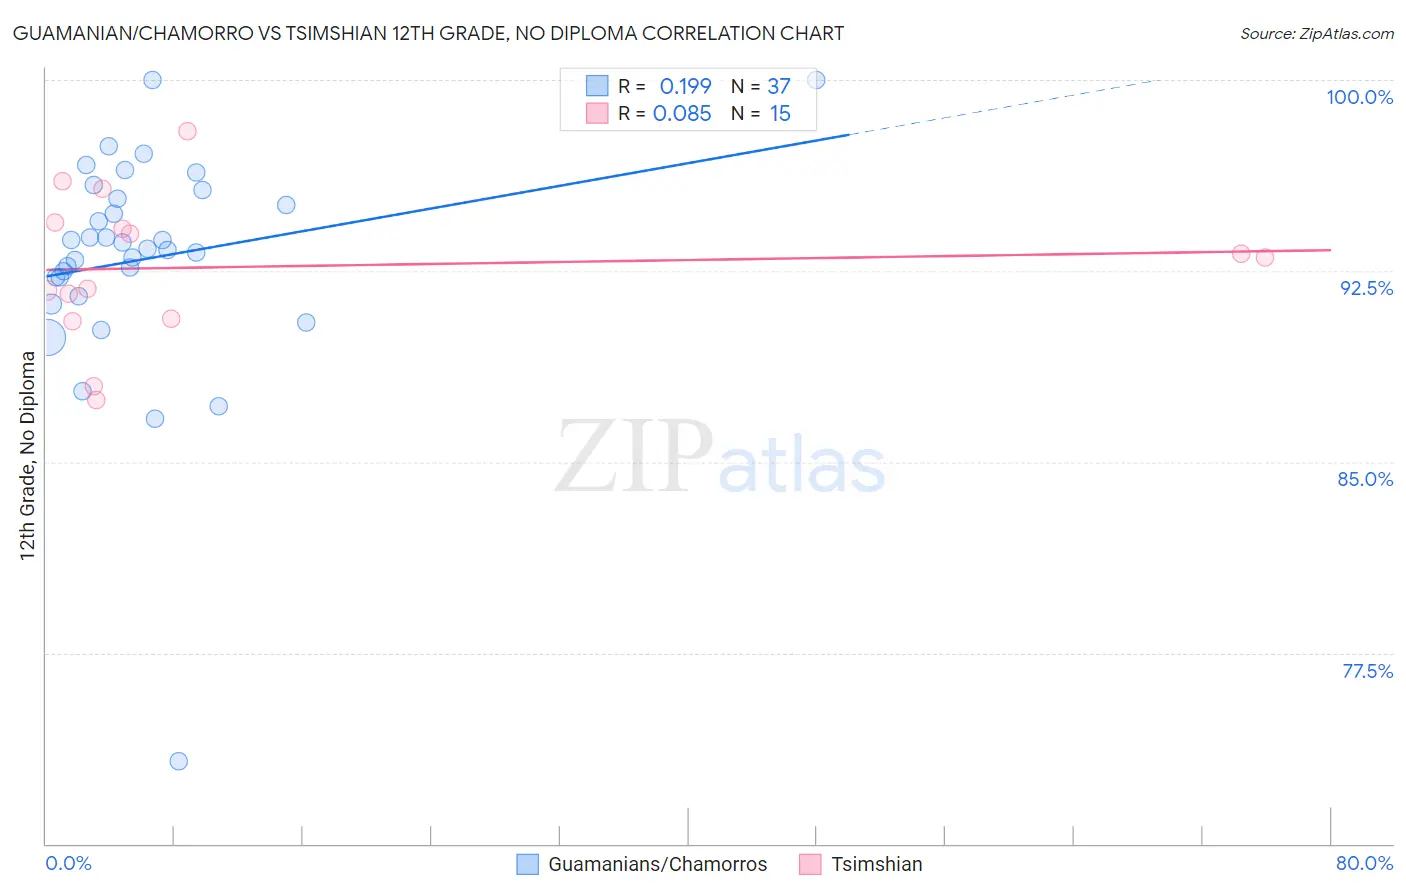
Guamanian/Chamorro vs Tsimshian 12th Grade, No Diploma Correlation Chart
The statistical analysis conducted on geographies consisting of 221,965,618 people shows a poor positive correlation between the proportion of Guamanians/Chamorros and percentage of population with at least 12th grade (no diploma) education in the United States with a correlation coefficient (R) of 0.199 and weighted average of 91.0%. Similarly, the statistical analysis conducted on geographies consisting of 15,626,544 people shows a slight positive correlation between the proportion of Tsimshian and percentage of population with at least 12th grade (no diploma) education in the United States with a correlation coefficient (R) of 0.085 and weighted average of 92.9%, a difference of 2.0%.
12th Grade, No Diploma Correlation Summary
| Measurement | Guamanian/Chamorro | Tsimshian |
| Minimum | 73.2% | 87.4% |
| Maximum | 100.0% | 98.0% |
| Range | 26.8% | 10.6% |
| Mean | 93.0% | 92.7% |
| Median | 93.4% | 93.0% |
| Interquartile 25% (IQ1) | 91.9% | 90.6% |
| Interquartile 75% (IQ3) | 95.5% | 94.4% |
| Interquartile Range (IQR) | 3.6% | 3.8% |
| Standard Deviation (Sample) | 4.5% | 2.9% |
| Standard Deviation (Population) | 4.4% | 2.8% |
Similar Demographics by 12th Grade, No Diploma
Demographics Similar to Guamanians/Chamorros by 12th Grade, No Diploma
In terms of 12th grade, no diploma, the demographic groups most similar to Guamanians/Chamorros are Immigrants from Syria (91.1%, a difference of 0.010%), Nonimmigrants (91.0%, a difference of 0.010%), Osage (91.0%, a difference of 0.020%), Spaniard (91.0%, a difference of 0.040%), and Spanish (91.1%, a difference of 0.050%).
| Demographics | Rating | Rank | 12th Grade, No Diploma |
| Immigrants | Nepal | 50.0 /100 | #174 | Average 91.2% |
| Immigrants | Western Asia | 49.0 /100 | #175 | Average 91.2% |
| Iroquois | 48.5 /100 | #176 | Average 91.1% |
| Sierra Leoneans | 47.7 /100 | #177 | Average 91.1% |
| Spanish | 43.7 /100 | #178 | Average 91.1% |
| Immigrants | Chile | 43.3 /100 | #179 | Average 91.1% |
| Immigrants | Syria | 40.3 /100 | #180 | Average 91.1% |
| Guamanians/Chamorros | 39.5 /100 | #181 | Fair 91.0% |
| Immigrants | Nonimmigrants | 38.8 /100 | #182 | Fair 91.0% |
| Osage | 38.3 /100 | #183 | Fair 91.0% |
| Spaniards | 36.2 /100 | #184 | Fair 91.0% |
| Sudanese | 34.4 /100 | #185 | Fair 91.0% |
| Ethiopians | 33.9 /100 | #186 | Fair 91.0% |
| Potawatomi | 32.9 /100 | #187 | Fair 91.0% |
| Americans | 32.6 /100 | #188 | Fair 91.0% |
Demographics Similar to Tsimshian by 12th Grade, No Diploma
In terms of 12th grade, no diploma, the demographic groups most similar to Tsimshian are Immigrants from Belgium (92.9%, a difference of 0.0%), Macedonian (92.9%, a difference of 0.010%), Immigrants from Sweden (92.8%, a difference of 0.010%), Australian (92.9%, a difference of 0.020%), and Belgian (92.9%, a difference of 0.030%).
| Demographics | Rating | Rank | 12th Grade, No Diploma |
| Northern Europeans | 99.8 /100 | #43 | Exceptional 92.9% |
| Dutch | 99.8 /100 | #44 | Exceptional 92.9% |
| Greeks | 99.8 /100 | #45 | Exceptional 92.9% |
| British | 99.8 /100 | #46 | Exceptional 92.9% |
| Belgians | 99.8 /100 | #47 | Exceptional 92.9% |
| Australians | 99.8 /100 | #48 | Exceptional 92.9% |
| Macedonians | 99.8 /100 | #49 | Exceptional 92.9% |
| Tsimshian | 99.8 /100 | #50 | Exceptional 92.9% |
| Immigrants | Belgium | 99.8 /100 | #51 | Exceptional 92.9% |
| Immigrants | Sweden | 99.8 /100 | #52 | Exceptional 92.8% |
| Serbians | 99.7 /100 | #53 | Exceptional 92.8% |
| Hungarians | 99.7 /100 | #54 | Exceptional 92.8% |
| Welsh | 99.7 /100 | #55 | Exceptional 92.8% |
| New Zealanders | 99.7 /100 | #56 | Exceptional 92.8% |
| Immigrants | Canada | 99.7 /100 | #57 | Exceptional 92.8% |