Guamanian/Chamorro vs Creek 12th Grade, No Diploma
COMPARE
Guamanian/Chamorro
Creek
12th Grade, No Diploma
12th Grade, No Diploma Comparison
Guamanians/Chamorros
Creek
91.0%
12TH GRADE, NO DIPLOMA
39.5/ 100
METRIC RATING
181st/ 347
METRIC RANK
90.3%
12TH GRADE, NO DIPLOMA
3.9/ 100
METRIC RATING
228th/ 347
METRIC RANK
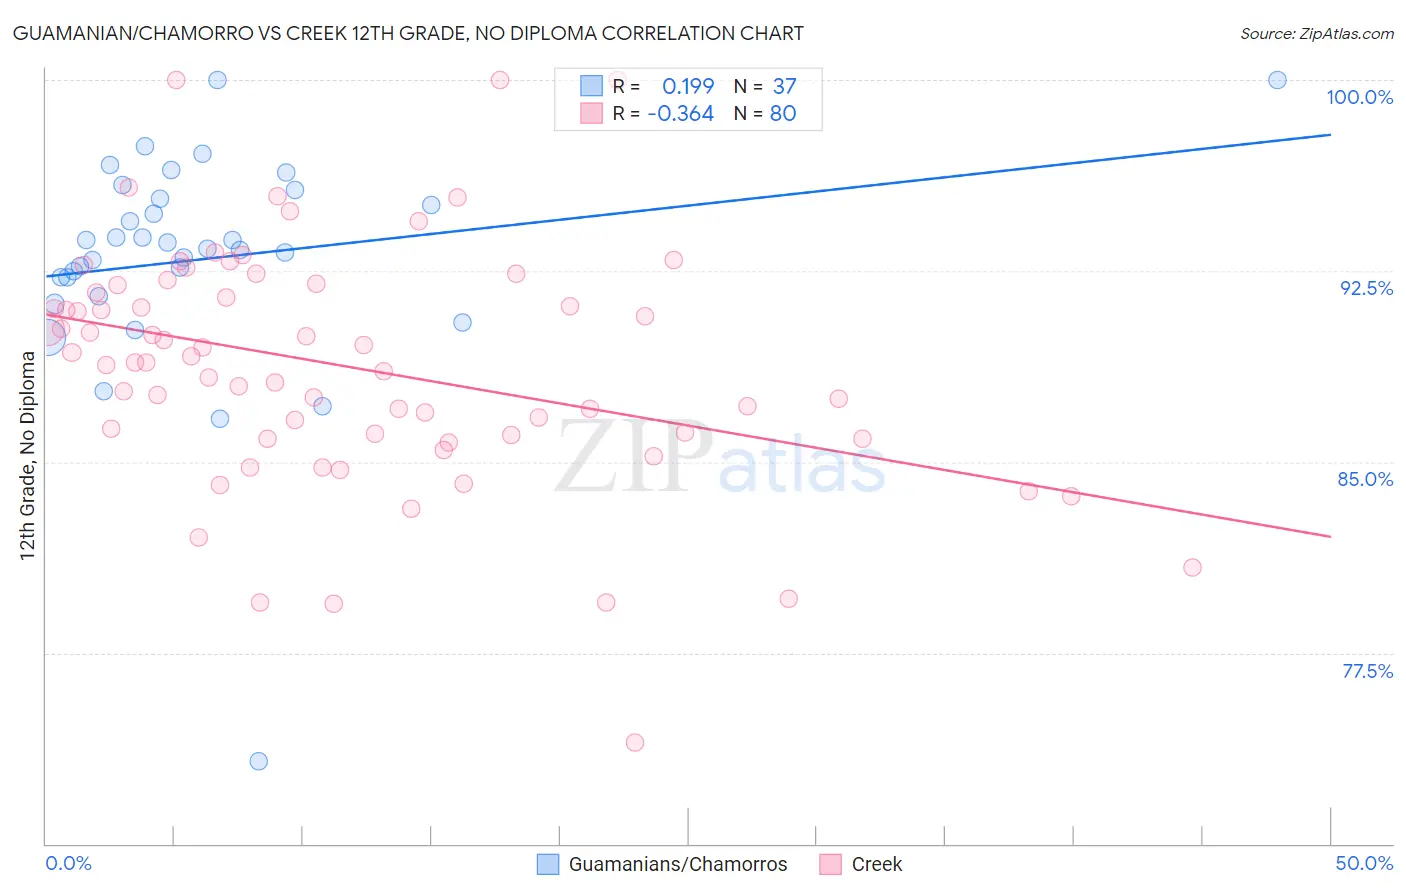
Guamanian/Chamorro vs Creek 12th Grade, No Diploma Correlation Chart
The statistical analysis conducted on geographies consisting of 221,965,618 people shows a poor positive correlation between the proportion of Guamanians/Chamorros and percentage of population with at least 12th grade (no diploma) education in the United States with a correlation coefficient (R) of 0.199 and weighted average of 91.0%. Similarly, the statistical analysis conducted on geographies consisting of 178,480,629 people shows a mild negative correlation between the proportion of Creek and percentage of population with at least 12th grade (no diploma) education in the United States with a correlation coefficient (R) of -0.364 and weighted average of 90.3%, a difference of 0.86%.
12th Grade, No Diploma Correlation Summary
| Measurement | Guamanian/Chamorro | Creek |
| Minimum | 73.2% | 74.0% |
| Maximum | 100.0% | 100.0% |
| Range | 26.8% | 26.0% |
| Mean | 93.0% | 88.7% |
| Median | 93.4% | 88.9% |
| Interquartile 25% (IQ1) | 91.9% | 86.0% |
| Interquartile 75% (IQ3) | 95.5% | 91.8% |
| Interquartile Range (IQR) | 3.6% | 5.8% |
| Standard Deviation (Sample) | 4.5% | 4.7% |
| Standard Deviation (Population) | 4.4% | 4.7% |
Similar Demographics by 12th Grade, No Diploma
Demographics Similar to Guamanians/Chamorros by 12th Grade, No Diploma
In terms of 12th grade, no diploma, the demographic groups most similar to Guamanians/Chamorros are Immigrants from Syria (91.1%, a difference of 0.010%), Nonimmigrants (91.0%, a difference of 0.010%), Osage (91.0%, a difference of 0.020%), Spaniard (91.0%, a difference of 0.040%), and Spanish (91.1%, a difference of 0.050%).
| Demographics | Rating | Rank | 12th Grade, No Diploma |
| Immigrants | Nepal | 50.0 /100 | #174 | Average 91.2% |
| Immigrants | Western Asia | 49.0 /100 | #175 | Average 91.2% |
| Iroquois | 48.5 /100 | #176 | Average 91.1% |
| Sierra Leoneans | 47.7 /100 | #177 | Average 91.1% |
| Spanish | 43.7 /100 | #178 | Average 91.1% |
| Immigrants | Chile | 43.3 /100 | #179 | Average 91.1% |
| Immigrants | Syria | 40.3 /100 | #180 | Average 91.1% |
| Guamanians/Chamorros | 39.5 /100 | #181 | Fair 91.0% |
| Immigrants | Nonimmigrants | 38.8 /100 | #182 | Fair 91.0% |
| Osage | 38.3 /100 | #183 | Fair 91.0% |
| Spaniards | 36.2 /100 | #184 | Fair 91.0% |
| Sudanese | 34.4 /100 | #185 | Fair 91.0% |
| Ethiopians | 33.9 /100 | #186 | Fair 91.0% |
| Potawatomi | 32.9 /100 | #187 | Fair 91.0% |
| Americans | 32.6 /100 | #188 | Fair 91.0% |
Demographics Similar to Creek by 12th Grade, No Diploma
In terms of 12th grade, no diploma, the demographic groups most similar to Creek are Immigrants from Bahamas (90.2%, a difference of 0.020%), Immigrants from Zaire (90.3%, a difference of 0.050%), Nigerian (90.3%, a difference of 0.050%), Immigrants from Panama (90.3%, a difference of 0.070%), and Chickasaw (90.3%, a difference of 0.070%).
| Demographics | Rating | Rank | 12th Grade, No Diploma |
| Immigrants | Liberia | 5.7 /100 | #221 | Tragic 90.4% |
| Immigrants | Somalia | 5.3 /100 | #222 | Tragic 90.4% |
| South Americans | 5.0 /100 | #223 | Tragic 90.3% |
| Immigrants | Panama | 4.8 /100 | #224 | Tragic 90.3% |
| Chickasaw | 4.8 /100 | #225 | Tragic 90.3% |
| Immigrants | Zaire | 4.6 /100 | #226 | Tragic 90.3% |
| Nigerians | 4.5 /100 | #227 | Tragic 90.3% |
| Creek | 3.9 /100 | #228 | Tragic 90.3% |
| Immigrants | Bahamas | 3.6 /100 | #229 | Tragic 90.2% |
| Immigrants | Philippines | 2.8 /100 | #230 | Tragic 90.2% |
| Peruvians | 2.7 /100 | #231 | Tragic 90.2% |
| Blackfeet | 2.4 /100 | #232 | Tragic 90.1% |
| Immigrants | Thailand | 2.3 /100 | #233 | Tragic 90.1% |
| Immigrants | South America | 2.3 /100 | #234 | Tragic 90.1% |
| Colville | 2.3 /100 | #235 | Tragic 90.1% |