Sierra Leonean vs Immigrants from Sudan 12th Grade, No Diploma
COMPARE
Sierra Leonean
Immigrants from Sudan
12th Grade, No Diploma
12th Grade, No Diploma Comparison
Sierra Leoneans
Immigrants from Sudan
91.1%
12TH GRADE, NO DIPLOMA
47.7/ 100
METRIC RATING
177th/ 347
METRIC RANK
90.8%
12TH GRADE, NO DIPLOMA
22.6/ 100
METRIC RATING
197th/ 347
METRIC RANK
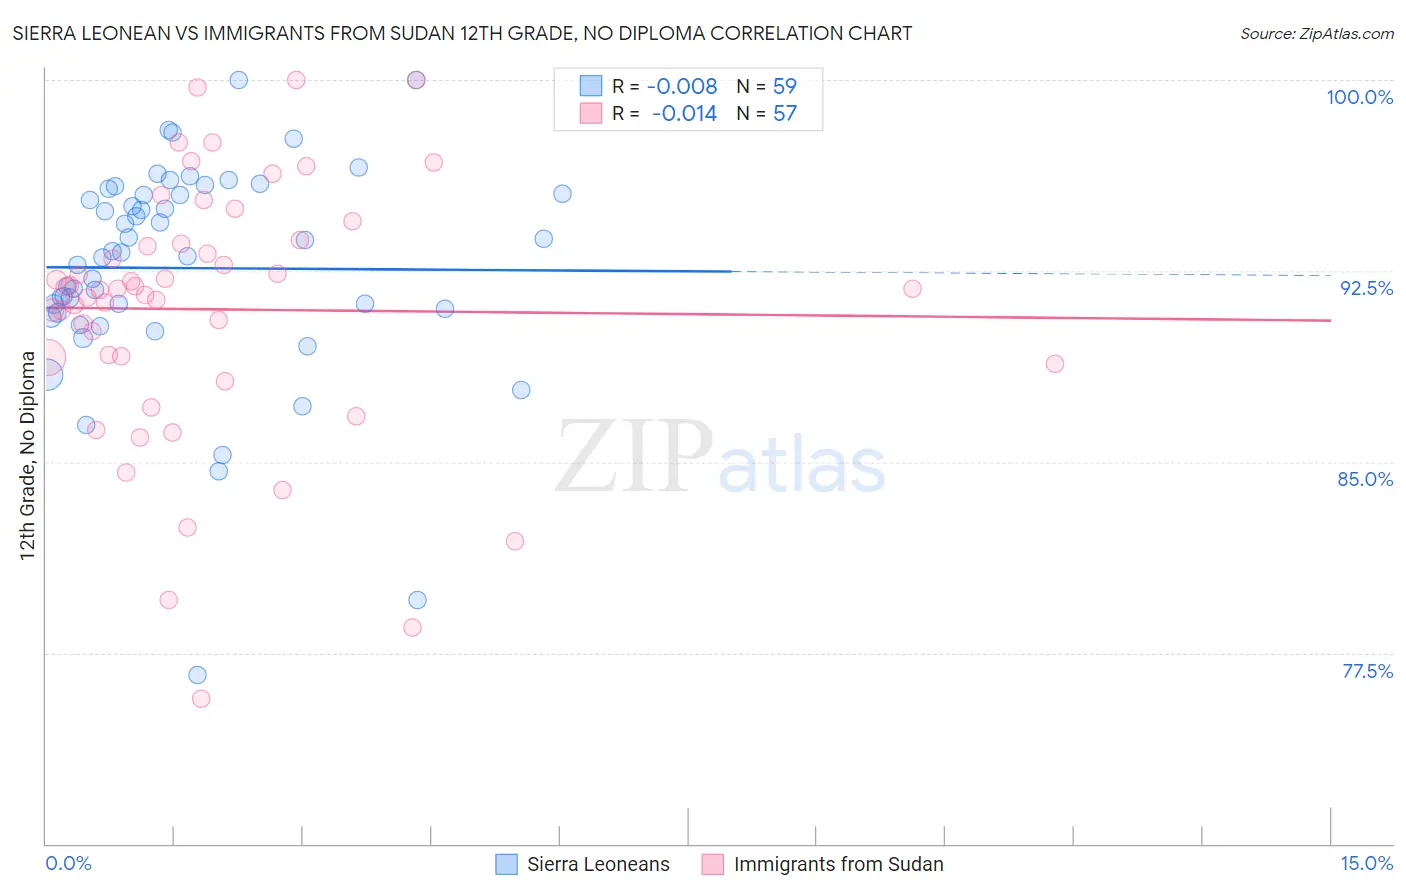
Sierra Leonean vs Immigrants from Sudan 12th Grade, No Diploma Correlation Chart
The statistical analysis conducted on geographies consisting of 83,363,012 people shows no correlation between the proportion of Sierra Leoneans and percentage of population with at least 12th grade (no diploma) education in the United States with a correlation coefficient (R) of -0.008 and weighted average of 91.1%. Similarly, the statistical analysis conducted on geographies consisting of 118,959,807 people shows no correlation between the proportion of Immigrants from Sudan and percentage of population with at least 12th grade (no diploma) education in the United States with a correlation coefficient (R) of -0.014 and weighted average of 90.8%, a difference of 0.35%.
12th Grade, No Diploma Correlation Summary
| Measurement | Sierra Leonean | Immigrants from Sudan |
| Minimum | 76.6% | 75.7% |
| Maximum | 100.0% | 100.0% |
| Range | 23.4% | 24.3% |
| Mean | 92.6% | 91.0% |
| Median | 93.2% | 91.8% |
| Interquartile 25% (IQ1) | 90.9% | 89.0% |
| Interquartile 75% (IQ3) | 95.5% | 93.7% |
| Interquartile Range (IQR) | 4.7% | 4.7% |
| Standard Deviation (Sample) | 4.3% | 5.1% |
| Standard Deviation (Population) | 4.3% | 5.1% |
Demographics Similar to Sierra Leoneans and Immigrants from Sudan by 12th Grade, No Diploma
In terms of 12th grade, no diploma, the demographic groups most similar to Sierra Leoneans are Spanish (91.1%, a difference of 0.050%), Immigrants from Chile (91.1%, a difference of 0.050%), Immigrants from Syria (91.1%, a difference of 0.090%), Guamanian/Chamorro (91.0%, a difference of 0.10%), and Nonimmigrants (91.0%, a difference of 0.11%). Similarly, the demographic groups most similar to Immigrants from Sudan are Panamanian (90.8%, a difference of 0.0%), Korean (90.8%, a difference of 0.030%), Immigrants from Oceania (90.9%, a difference of 0.060%), Immigrants from Eastern Africa (90.9%, a difference of 0.080%), and Immigrants from Ethiopia (90.9%, a difference of 0.080%).
| Demographics | Rating | Rank | 12th Grade, No Diploma |
| Sierra Leoneans | 47.7 /100 | #177 | Average 91.1% |
| Spanish | 43.7 /100 | #178 | Average 91.1% |
| Immigrants | Chile | 43.3 /100 | #179 | Average 91.1% |
| Immigrants | Syria | 40.3 /100 | #180 | Average 91.1% |
| Guamanians/Chamorros | 39.5 /100 | #181 | Fair 91.0% |
| Immigrants | Nonimmigrants | 38.8 /100 | #182 | Fair 91.0% |
| Osage | 38.3 /100 | #183 | Fair 91.0% |
| Spaniards | 36.2 /100 | #184 | Fair 91.0% |
| Sudanese | 34.4 /100 | #185 | Fair 91.0% |
| Ethiopians | 33.9 /100 | #186 | Fair 91.0% |
| Potawatomi | 32.9 /100 | #187 | Fair 91.0% |
| Americans | 32.6 /100 | #188 | Fair 91.0% |
| Immigrants | Uganda | 31.6 /100 | #189 | Fair 90.9% |
| Afghans | 29.9 /100 | #190 | Fair 90.9% |
| Moroccans | 28.8 /100 | #191 | Fair 90.9% |
| Immigrants | Eastern Africa | 27.7 /100 | #192 | Fair 90.9% |
| Immigrants | Ethiopia | 27.2 /100 | #193 | Fair 90.9% |
| Immigrants | Oceania | 26.0 /100 | #194 | Fair 90.9% |
| Koreans | 24.5 /100 | #195 | Fair 90.8% |
| Panamanians | 22.8 /100 | #196 | Fair 90.8% |
| Immigrants | Sudan | 22.6 /100 | #197 | Fair 90.8% |