Immigrants from Cuba vs Immigrants from Sudan 12th Grade, No Diploma
COMPARE
Immigrants from Cuba
Immigrants from Sudan
12th Grade, No Diploma
12th Grade, No Diploma Comparison
Immigrants from Cuba
Immigrants from Sudan
87.5%
12TH GRADE, NO DIPLOMA
0.0/ 100
METRIC RATING
310th/ 347
METRIC RANK
90.8%
12TH GRADE, NO DIPLOMA
22.6/ 100
METRIC RATING
197th/ 347
METRIC RANK
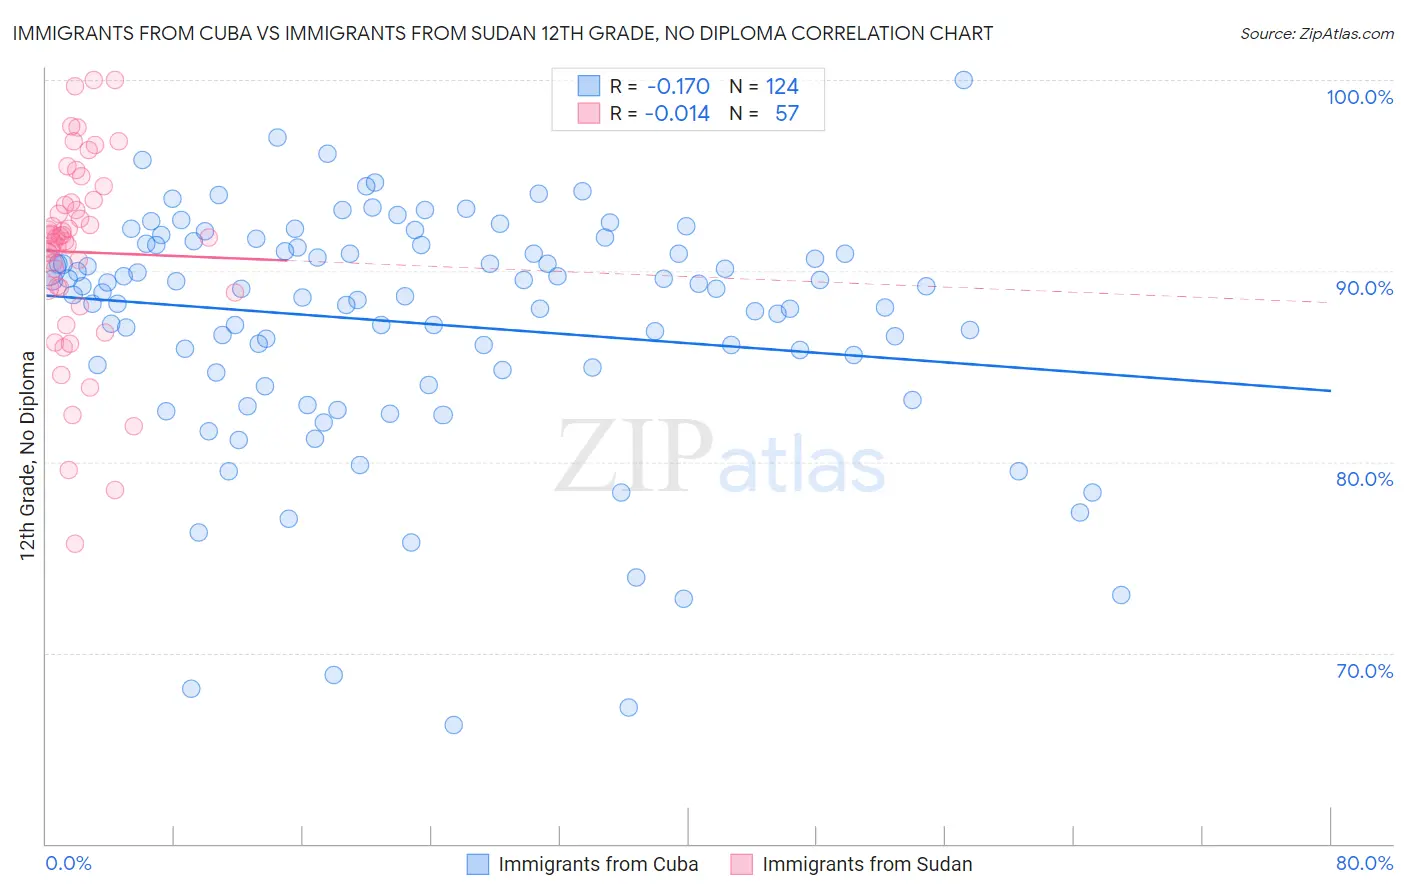
Immigrants from Cuba vs Immigrants from Sudan 12th Grade, No Diploma Correlation Chart
The statistical analysis conducted on geographies consisting of 326,028,015 people shows a poor negative correlation between the proportion of Immigrants from Cuba and percentage of population with at least 12th grade (no diploma) education in the United States with a correlation coefficient (R) of -0.170 and weighted average of 87.5%. Similarly, the statistical analysis conducted on geographies consisting of 118,959,807 people shows no correlation between the proportion of Immigrants from Sudan and percentage of population with at least 12th grade (no diploma) education in the United States with a correlation coefficient (R) of -0.014 and weighted average of 90.8%, a difference of 3.8%.
12th Grade, No Diploma Correlation Summary
| Measurement | Immigrants from Cuba | Immigrants from Sudan |
| Minimum | 66.2% | 75.7% |
| Maximum | 100.0% | 100.0% |
| Range | 33.8% | 24.3% |
| Mean | 87.3% | 91.0% |
| Median | 89.0% | 91.8% |
| Interquartile 25% (IQ1) | 84.9% | 89.0% |
| Interquartile 75% (IQ3) | 91.3% | 93.7% |
| Interquartile Range (IQR) | 6.4% | 4.7% |
| Standard Deviation (Sample) | 6.2% | 5.1% |
| Standard Deviation (Population) | 6.2% | 5.1% |
Similar Demographics by 12th Grade, No Diploma
Demographics Similar to Immigrants from Cuba by 12th Grade, No Diploma
In terms of 12th grade, no diploma, the demographic groups most similar to Immigrants from Cuba are Yaqui (87.5%, a difference of 0.040%), Immigrants from Armenia (87.6%, a difference of 0.050%), Immigrants from Ecuador (87.5%, a difference of 0.050%), Yup'ik (87.6%, a difference of 0.080%), and Immigrants from Portugal (87.6%, a difference of 0.12%).
| Demographics | Rating | Rank | 12th Grade, No Diploma |
| Immigrants | Bangladesh | 0.0 /100 | #303 | Tragic 88.0% |
| Vietnamese | 0.0 /100 | #304 | Tragic 87.9% |
| Immigrants | Dominica | 0.0 /100 | #305 | Tragic 87.7% |
| Natives/Alaskans | 0.0 /100 | #306 | Tragic 87.7% |
| Immigrants | Portugal | 0.0 /100 | #307 | Tragic 87.6% |
| Yup'ik | 0.0 /100 | #308 | Tragic 87.6% |
| Immigrants | Armenia | 0.0 /100 | #309 | Tragic 87.6% |
| Immigrants | Cuba | 0.0 /100 | #310 | Tragic 87.5% |
| Yaqui | 0.0 /100 | #311 | Tragic 87.5% |
| Immigrants | Ecuador | 0.0 /100 | #312 | Tragic 87.5% |
| Immigrants | Caribbean | 0.0 /100 | #313 | Tragic 87.4% |
| Cape Verdeans | 0.0 /100 | #314 | Tragic 87.4% |
| Nicaraguans | 0.0 /100 | #315 | Tragic 87.3% |
| Apache | 0.0 /100 | #316 | Tragic 87.3% |
| Navajo | 0.0 /100 | #317 | Tragic 87.1% |
Demographics Similar to Immigrants from Sudan by 12th Grade, No Diploma
In terms of 12th grade, no diploma, the demographic groups most similar to Immigrants from Sudan are Panamanian (90.8%, a difference of 0.0%), Korean (90.8%, a difference of 0.030%), Samoan (90.8%, a difference of 0.040%), Immigrants from Southern Europe (90.8%, a difference of 0.050%), and Liberian (90.8%, a difference of 0.050%).
| Demographics | Rating | Rank | 12th Grade, No Diploma |
| Afghans | 29.9 /100 | #190 | Fair 90.9% |
| Moroccans | 28.8 /100 | #191 | Fair 90.9% |
| Immigrants | Eastern Africa | 27.7 /100 | #192 | Fair 90.9% |
| Immigrants | Ethiopia | 27.2 /100 | #193 | Fair 90.9% |
| Immigrants | Oceania | 26.0 /100 | #194 | Fair 90.9% |
| Koreans | 24.5 /100 | #195 | Fair 90.8% |
| Panamanians | 22.8 /100 | #196 | Fair 90.8% |
| Immigrants | Sudan | 22.6 /100 | #197 | Fair 90.8% |
| Samoans | 20.4 /100 | #198 | Fair 90.8% |
| Immigrants | Southern Europe | 19.9 /100 | #199 | Poor 90.8% |
| Liberians | 19.8 /100 | #200 | Poor 90.8% |
| Hawaiians | 19.7 /100 | #201 | Poor 90.8% |
| Marshallese | 18.2 /100 | #202 | Poor 90.7% |
| Tongans | 16.1 /100 | #203 | Poor 90.7% |
| French American Indians | 15.5 /100 | #204 | Poor 90.7% |