Guamanian/Chamorro vs Immigrants from France 12th Grade, No Diploma
COMPARE
Guamanian/Chamorro
Immigrants from France
12th Grade, No Diploma
12th Grade, No Diploma Comparison
Guamanians/Chamorros
Immigrants from France
91.0%
12TH GRADE, NO DIPLOMA
39.5/ 100
METRIC RATING
181st/ 347
METRIC RANK
92.4%
12TH GRADE, NO DIPLOMA
98.8/ 100
METRIC RATING
87th/ 347
METRIC RANK
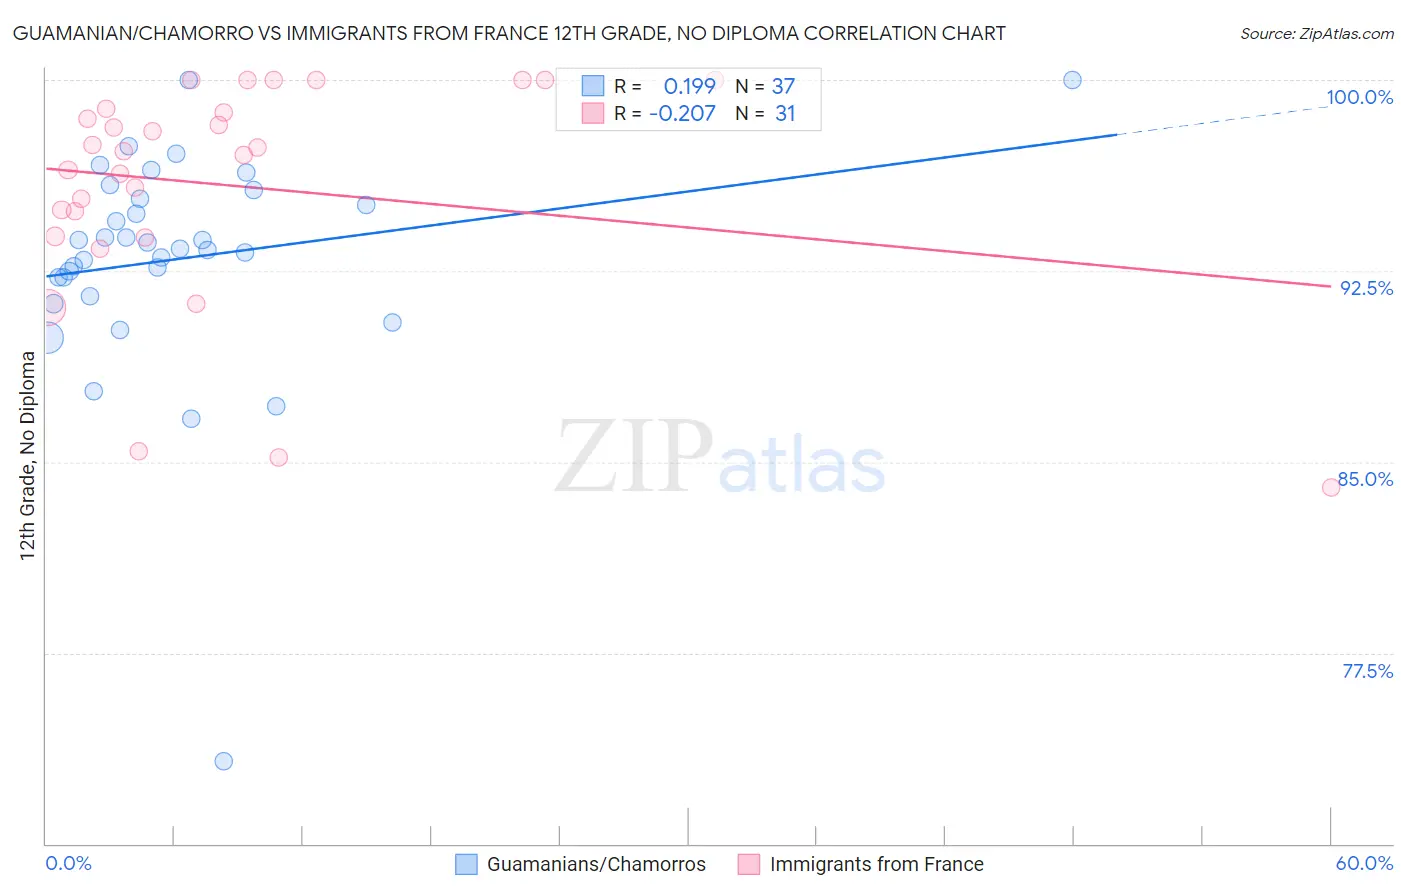
Guamanian/Chamorro vs Immigrants from France 12th Grade, No Diploma Correlation Chart
The statistical analysis conducted on geographies consisting of 221,965,618 people shows a poor positive correlation between the proportion of Guamanians/Chamorros and percentage of population with at least 12th grade (no diploma) education in the United States with a correlation coefficient (R) of 0.199 and weighted average of 91.0%. Similarly, the statistical analysis conducted on geographies consisting of 287,920,906 people shows a weak negative correlation between the proportion of Immigrants from France and percentage of population with at least 12th grade (no diploma) education in the United States with a correlation coefficient (R) of -0.207 and weighted average of 92.4%, a difference of 1.5%.
12th Grade, No Diploma Correlation Summary
| Measurement | Guamanian/Chamorro | Immigrants from France |
| Minimum | 73.2% | 84.0% |
| Maximum | 100.0% | 100.0% |
| Range | 26.8% | 16.0% |
| Mean | 93.0% | 95.8% |
| Median | 93.4% | 97.2% |
| Interquartile 25% (IQ1) | 91.9% | 93.9% |
| Interquartile 75% (IQ3) | 95.5% | 98.9% |
| Interquartile Range (IQR) | 3.6% | 5.0% |
| Standard Deviation (Sample) | 4.5% | 4.4% |
| Standard Deviation (Population) | 4.4% | 4.4% |
Similar Demographics by 12th Grade, No Diploma
Demographics Similar to Guamanians/Chamorros by 12th Grade, No Diploma
In terms of 12th grade, no diploma, the demographic groups most similar to Guamanians/Chamorros are Immigrants from Syria (91.1%, a difference of 0.010%), Nonimmigrants (91.0%, a difference of 0.010%), Osage (91.0%, a difference of 0.020%), Spaniard (91.0%, a difference of 0.040%), and Spanish (91.1%, a difference of 0.050%).
| Demographics | Rating | Rank | 12th Grade, No Diploma |
| Immigrants | Nepal | 50.0 /100 | #174 | Average 91.2% |
| Immigrants | Western Asia | 49.0 /100 | #175 | Average 91.2% |
| Iroquois | 48.5 /100 | #176 | Average 91.1% |
| Sierra Leoneans | 47.7 /100 | #177 | Average 91.1% |
| Spanish | 43.7 /100 | #178 | Average 91.1% |
| Immigrants | Chile | 43.3 /100 | #179 | Average 91.1% |
| Immigrants | Syria | 40.3 /100 | #180 | Average 91.1% |
| Guamanians/Chamorros | 39.5 /100 | #181 | Fair 91.0% |
| Immigrants | Nonimmigrants | 38.8 /100 | #182 | Fair 91.0% |
| Osage | 38.3 /100 | #183 | Fair 91.0% |
| Spaniards | 36.2 /100 | #184 | Fair 91.0% |
| Sudanese | 34.4 /100 | #185 | Fair 91.0% |
| Ethiopians | 33.9 /100 | #186 | Fair 91.0% |
| Potawatomi | 32.9 /100 | #187 | Fair 91.0% |
| Americans | 32.6 /100 | #188 | Fair 91.0% |
Demographics Similar to Immigrants from France by 12th Grade, No Diploma
In terms of 12th grade, no diploma, the demographic groups most similar to Immigrants from France are Scotch-Irish (92.4%, a difference of 0.010%), Immigrants from Turkey (92.4%, a difference of 0.020%), Canadian (92.4%, a difference of 0.030%), Immigrants from Serbia (92.4%, a difference of 0.040%), and South African (92.4%, a difference of 0.050%).
| Demographics | Rating | Rank | 12th Grade, No Diploma |
| French Canadians | 99.3 /100 | #80 | Exceptional 92.6% |
| Immigrants | Denmark | 99.2 /100 | #81 | Exceptional 92.5% |
| Immigrants | Switzerland | 99.2 /100 | #82 | Exceptional 92.5% |
| Immigrants | Israel | 99.2 /100 | #83 | Exceptional 92.5% |
| Immigrants | Bulgaria | 99.1 /100 | #84 | Exceptional 92.5% |
| Immigrants | Saudi Arabia | 99.0 /100 | #85 | Exceptional 92.5% |
| Immigrants | Turkey | 98.9 /100 | #86 | Exceptional 92.4% |
| Immigrants | France | 98.8 /100 | #87 | Exceptional 92.4% |
| Scotch-Irish | 98.8 /100 | #88 | Exceptional 92.4% |
| Canadians | 98.7 /100 | #89 | Exceptional 92.4% |
| Immigrants | Serbia | 98.6 /100 | #90 | Exceptional 92.4% |
| South Africans | 98.6 /100 | #91 | Exceptional 92.4% |
| Immigrants | Romania | 98.5 /100 | #92 | Exceptional 92.3% |
| Immigrants | Western Europe | 98.5 /100 | #93 | Exceptional 92.3% |
| Immigrants | Europe | 98.5 /100 | #94 | Exceptional 92.3% |