Guamanian/Chamorro vs Guatemalan 12th Grade, No Diploma
COMPARE
Guamanian/Chamorro
Guatemalan
12th Grade, No Diploma
12th Grade, No Diploma Comparison
Guamanians/Chamorros
Guatemalans
91.0%
12TH GRADE, NO DIPLOMA
39.5/ 100
METRIC RATING
181st/ 347
METRIC RANK
84.6%
12TH GRADE, NO DIPLOMA
0.0/ 100
METRIC RATING
338th/ 347
METRIC RANK
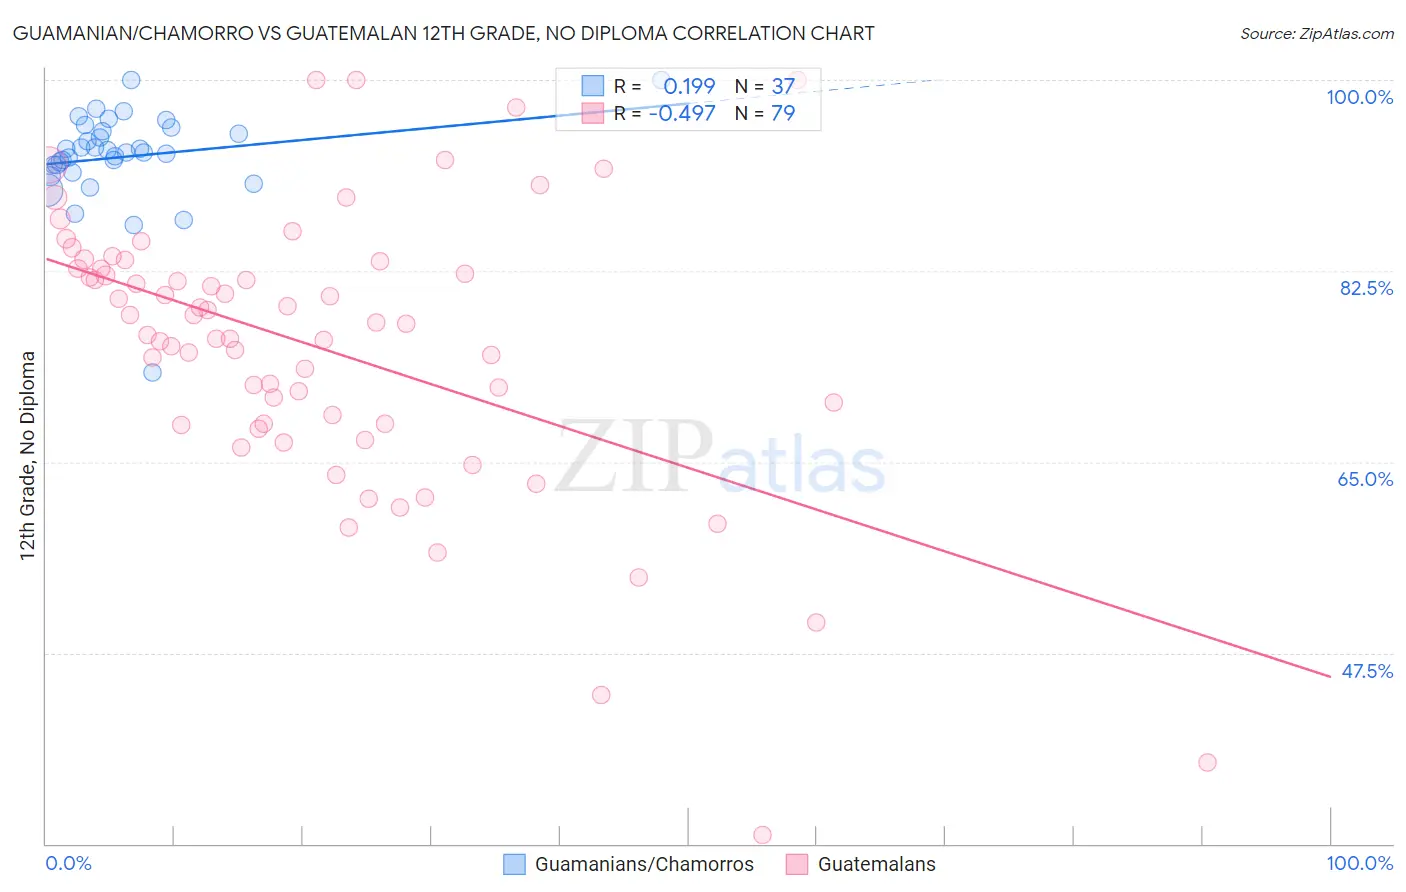
Guamanian/Chamorro vs Guatemalan 12th Grade, No Diploma Correlation Chart
The statistical analysis conducted on geographies consisting of 221,965,618 people shows a poor positive correlation between the proportion of Guamanians/Chamorros and percentage of population with at least 12th grade (no diploma) education in the United States with a correlation coefficient (R) of 0.199 and weighted average of 91.0%. Similarly, the statistical analysis conducted on geographies consisting of 409,566,618 people shows a moderate negative correlation between the proportion of Guatemalans and percentage of population with at least 12th grade (no diploma) education in the United States with a correlation coefficient (R) of -0.497 and weighted average of 84.6%, a difference of 7.7%.
12th Grade, No Diploma Correlation Summary
| Measurement | Guamanian/Chamorro | Guatemalan |
| Minimum | 73.2% | 30.8% |
| Maximum | 100.0% | 100.0% |
| Range | 26.8% | 69.2% |
| Mean | 93.0% | 75.5% |
| Median | 93.4% | 77.7% |
| Interquartile 25% (IQ1) | 91.9% | 68.5% |
| Interquartile 75% (IQ3) | 95.5% | 82.7% |
| Interquartile Range (IQR) | 3.6% | 14.3% |
| Standard Deviation (Sample) | 4.5% | 13.0% |
| Standard Deviation (Population) | 4.4% | 12.9% |
Similar Demographics by 12th Grade, No Diploma
Demographics Similar to Guamanians/Chamorros by 12th Grade, No Diploma
In terms of 12th grade, no diploma, the demographic groups most similar to Guamanians/Chamorros are Immigrants from Syria (91.1%, a difference of 0.010%), Nonimmigrants (91.0%, a difference of 0.010%), Osage (91.0%, a difference of 0.020%), Spaniard (91.0%, a difference of 0.040%), and Spanish (91.1%, a difference of 0.050%).
| Demographics | Rating | Rank | 12th Grade, No Diploma |
| Immigrants | Nepal | 50.0 /100 | #174 | Average 91.2% |
| Immigrants | Western Asia | 49.0 /100 | #175 | Average 91.2% |
| Iroquois | 48.5 /100 | #176 | Average 91.1% |
| Sierra Leoneans | 47.7 /100 | #177 | Average 91.1% |
| Spanish | 43.7 /100 | #178 | Average 91.1% |
| Immigrants | Chile | 43.3 /100 | #179 | Average 91.1% |
| Immigrants | Syria | 40.3 /100 | #180 | Average 91.1% |
| Guamanians/Chamorros | 39.5 /100 | #181 | Fair 91.0% |
| Immigrants | Nonimmigrants | 38.8 /100 | #182 | Fair 91.0% |
| Osage | 38.3 /100 | #183 | Fair 91.0% |
| Spaniards | 36.2 /100 | #184 | Fair 91.0% |
| Sudanese | 34.4 /100 | #185 | Fair 91.0% |
| Ethiopians | 33.9 /100 | #186 | Fair 91.0% |
| Potawatomi | 32.9 /100 | #187 | Fair 91.0% |
| Americans | 32.6 /100 | #188 | Fair 91.0% |
Demographics Similar to Guatemalans by 12th Grade, No Diploma
In terms of 12th grade, no diploma, the demographic groups most similar to Guatemalans are Pima (84.6%, a difference of 0.040%), Salvadoran (84.5%, a difference of 0.10%), Tohono O'odham (84.7%, a difference of 0.18%), Immigrants from Yemen (84.8%, a difference of 0.32%), and Immigrants from Dominican Republic (84.9%, a difference of 0.36%).
| Demographics | Rating | Rank | 12th Grade, No Diploma |
| Central Americans | 0.0 /100 | #331 | Tragic 85.2% |
| Immigrants | Honduras | 0.0 /100 | #332 | Tragic 85.0% |
| Immigrants | Latin America | 0.0 /100 | #333 | Tragic 85.0% |
| Immigrants | Dominican Republic | 0.0 /100 | #334 | Tragic 84.9% |
| Immigrants | Yemen | 0.0 /100 | #335 | Tragic 84.8% |
| Tohono O'odham | 0.0 /100 | #336 | Tragic 84.7% |
| Pima | 0.0 /100 | #337 | Tragic 84.6% |
| Guatemalans | 0.0 /100 | #338 | Tragic 84.6% |
| Salvadorans | 0.0 /100 | #339 | Tragic 84.5% |
| Mexicans | 0.0 /100 | #340 | Tragic 84.1% |
| Immigrants | Guatemala | 0.0 /100 | #341 | Tragic 84.0% |
| Houma | 0.0 /100 | #342 | Tragic 83.7% |
| Immigrants | El Salvador | 0.0 /100 | #343 | Tragic 83.6% |
| Immigrants | Central America | 0.0 /100 | #344 | Tragic 83.0% |
| Spanish American Indians | 0.0 /100 | #345 | Tragic 82.9% |