Guamanian/Chamorro vs Immigrants from Belize 12th Grade, No Diploma
COMPARE
Guamanian/Chamorro
Immigrants from Belize
12th Grade, No Diploma
12th Grade, No Diploma Comparison
Guamanians/Chamorros
Immigrants from Belize
91.0%
12TH GRADE, NO DIPLOMA
39.5/ 100
METRIC RATING
181st/ 347
METRIC RANK
87.0%
12TH GRADE, NO DIPLOMA
0.0/ 100
METRIC RATING
319th/ 347
METRIC RANK
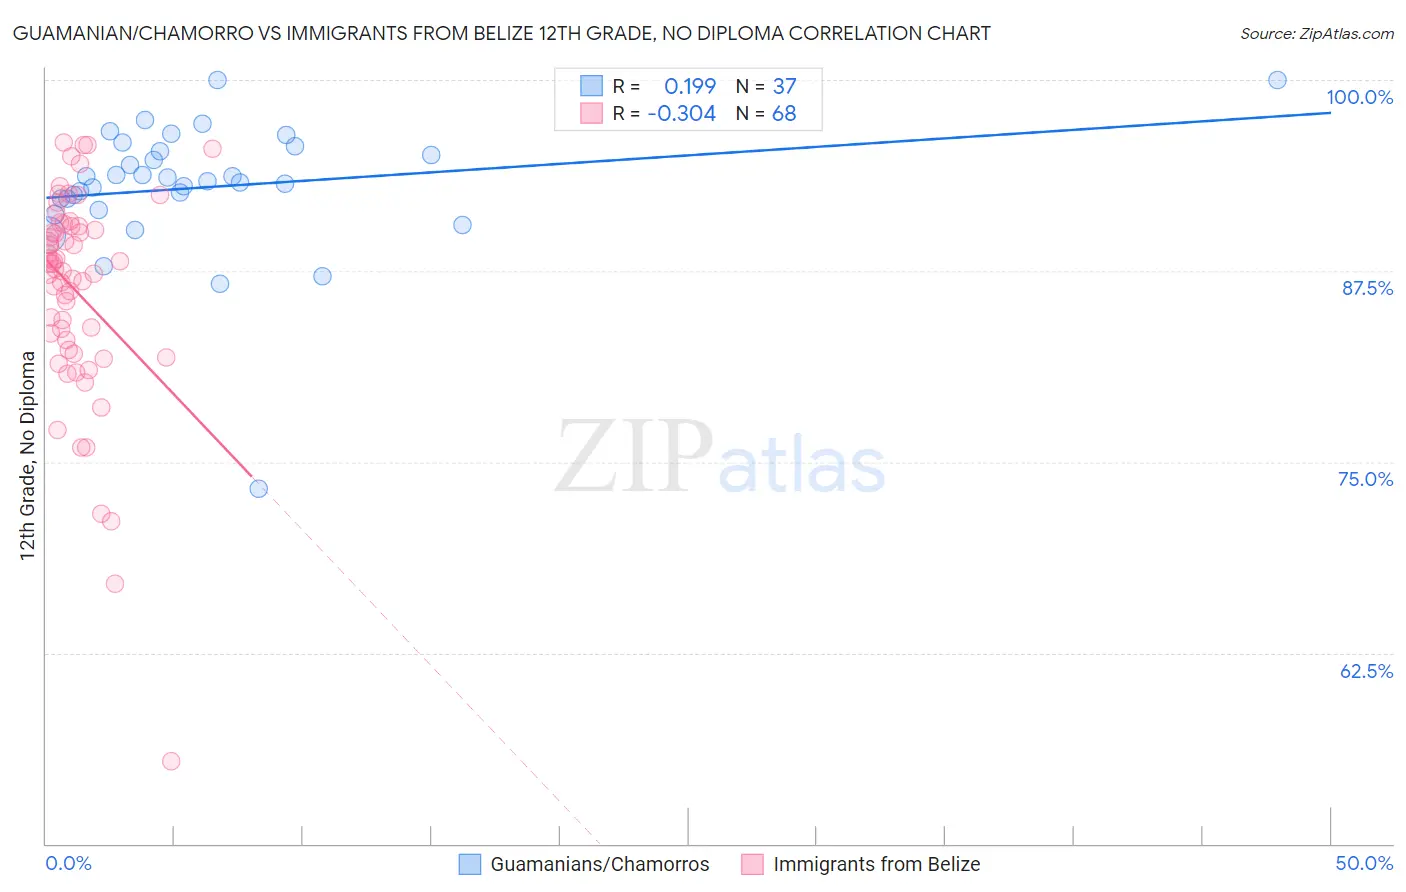
Guamanian/Chamorro vs Immigrants from Belize 12th Grade, No Diploma Correlation Chart
The statistical analysis conducted on geographies consisting of 221,965,618 people shows a poor positive correlation between the proportion of Guamanians/Chamorros and percentage of population with at least 12th grade (no diploma) education in the United States with a correlation coefficient (R) of 0.199 and weighted average of 91.0%. Similarly, the statistical analysis conducted on geographies consisting of 130,181,087 people shows a mild negative correlation between the proportion of Immigrants from Belize and percentage of population with at least 12th grade (no diploma) education in the United States with a correlation coefficient (R) of -0.304 and weighted average of 87.0%, a difference of 4.7%.
12th Grade, No Diploma Correlation Summary
| Measurement | Guamanian/Chamorro | Immigrants from Belize |
| Minimum | 73.2% | 55.4% |
| Maximum | 100.0% | 95.9% |
| Range | 26.8% | 40.5% |
| Mean | 93.0% | 86.1% |
| Median | 93.4% | 87.8% |
| Interquartile 25% (IQ1) | 91.9% | 82.6% |
| Interquartile 75% (IQ3) | 95.5% | 90.4% |
| Interquartile Range (IQR) | 3.6% | 7.8% |
| Standard Deviation (Sample) | 4.5% | 7.1% |
| Standard Deviation (Population) | 4.4% | 7.0% |
Similar Demographics by 12th Grade, No Diploma
Demographics Similar to Guamanians/Chamorros by 12th Grade, No Diploma
In terms of 12th grade, no diploma, the demographic groups most similar to Guamanians/Chamorros are Immigrants from Syria (91.1%, a difference of 0.010%), Nonimmigrants (91.0%, a difference of 0.010%), Osage (91.0%, a difference of 0.020%), Spaniard (91.0%, a difference of 0.040%), and Spanish (91.1%, a difference of 0.050%).
| Demographics | Rating | Rank | 12th Grade, No Diploma |
| Immigrants | Nepal | 50.0 /100 | #174 | Average 91.2% |
| Immigrants | Western Asia | 49.0 /100 | #175 | Average 91.2% |
| Iroquois | 48.5 /100 | #176 | Average 91.1% |
| Sierra Leoneans | 47.7 /100 | #177 | Average 91.1% |
| Spanish | 43.7 /100 | #178 | Average 91.1% |
| Immigrants | Chile | 43.3 /100 | #179 | Average 91.1% |
| Immigrants | Syria | 40.3 /100 | #180 | Average 91.1% |
| Guamanians/Chamorros | 39.5 /100 | #181 | Fair 91.0% |
| Immigrants | Nonimmigrants | 38.8 /100 | #182 | Fair 91.0% |
| Osage | 38.3 /100 | #183 | Fair 91.0% |
| Spaniards | 36.2 /100 | #184 | Fair 91.0% |
| Sudanese | 34.4 /100 | #185 | Fair 91.0% |
| Ethiopians | 33.9 /100 | #186 | Fair 91.0% |
| Potawatomi | 32.9 /100 | #187 | Fair 91.0% |
| Americans | 32.6 /100 | #188 | Fair 91.0% |
Demographics Similar to Immigrants from Belize by 12th Grade, No Diploma
In terms of 12th grade, no diploma, the demographic groups most similar to Immigrants from Belize are Belizean (87.0%, a difference of 0.080%), Navajo (87.1%, a difference of 0.14%), Apache (87.3%, a difference of 0.43%), Nicaraguan (87.3%, a difference of 0.44%), and Immigrants from Nicaragua (86.6%, a difference of 0.46%).
| Demographics | Rating | Rank | 12th Grade, No Diploma |
| Immigrants | Ecuador | 0.0 /100 | #312 | Tragic 87.5% |
| Immigrants | Caribbean | 0.0 /100 | #313 | Tragic 87.4% |
| Cape Verdeans | 0.0 /100 | #314 | Tragic 87.4% |
| Nicaraguans | 0.0 /100 | #315 | Tragic 87.3% |
| Apache | 0.0 /100 | #316 | Tragic 87.3% |
| Navajo | 0.0 /100 | #317 | Tragic 87.1% |
| Belizeans | 0.0 /100 | #318 | Tragic 87.0% |
| Immigrants | Belize | 0.0 /100 | #319 | Tragic 87.0% |
| Immigrants | Nicaragua | 0.0 /100 | #320 | Tragic 86.6% |
| Puerto Ricans | 0.0 /100 | #321 | Tragic 86.5% |
| Central American Indians | 0.0 /100 | #322 | Tragic 86.5% |
| Yuman | 0.0 /100 | #323 | Tragic 86.5% |
| Immigrants | Cabo Verde | 0.0 /100 | #324 | Tragic 85.8% |
| Mexican American Indians | 0.0 /100 | #325 | Tragic 85.7% |
| Dominicans | 0.0 /100 | #326 | Tragic 85.7% |