Jordanian vs Soviet Union High School Diploma
COMPARE
Jordanian
Soviet Union
High School Diploma
High School Diploma Comparison
Jordanians
Soviet Union
90.2%
HIGH SCHOOL DIPLOMA
95.4/ 100
METRIC RATING
117th/ 347
METRIC RANK
90.9%
HIGH SCHOOL DIPLOMA
99.4/ 100
METRIC RATING
72nd/ 347
METRIC RANK
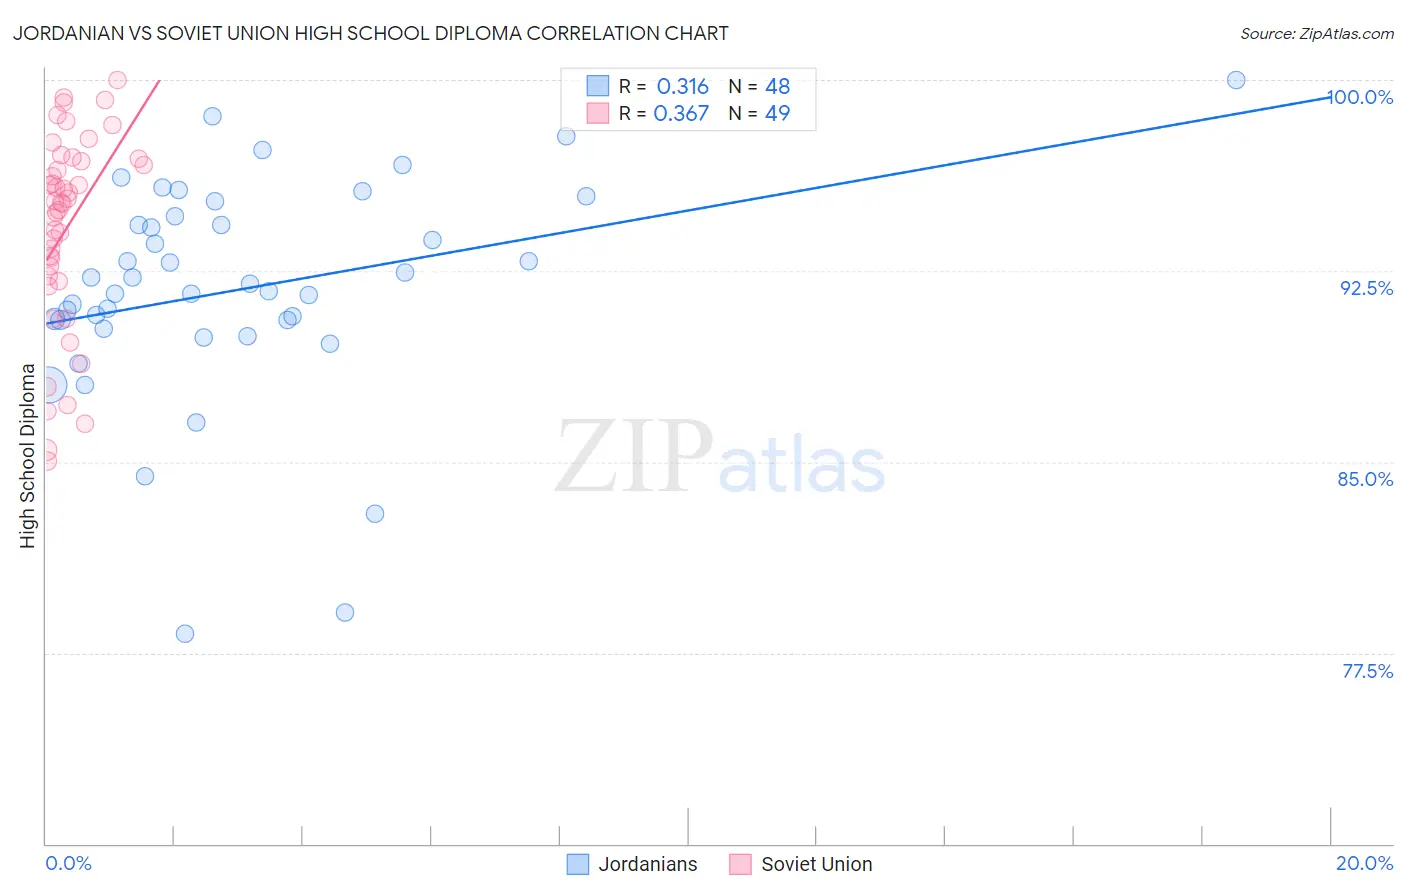
Jordanian vs Soviet Union High School Diploma Correlation Chart
The statistical analysis conducted on geographies consisting of 166,423,935 people shows a mild positive correlation between the proportion of Jordanians and percentage of population with at least high school diploma education in the United States with a correlation coefficient (R) of 0.316 and weighted average of 90.2%. Similarly, the statistical analysis conducted on geographies consisting of 43,454,395 people shows a mild positive correlation between the proportion of Soviet Union and percentage of population with at least high school diploma education in the United States with a correlation coefficient (R) of 0.367 and weighted average of 90.9%, a difference of 0.80%.
High School Diploma Correlation Summary
| Measurement | Jordanian | Soviet Union |
| Minimum | 78.2% | 85.0% |
| Maximum | 100.0% | 100.0% |
| Range | 21.8% | 15.0% |
| Mean | 91.8% | 94.2% |
| Median | 91.9% | 95.2% |
| Interquartile 25% (IQ1) | 90.4% | 92.2% |
| Interquartile 75% (IQ3) | 94.5% | 96.9% |
| Interquartile Range (IQR) | 4.1% | 4.7% |
| Standard Deviation (Sample) | 4.4% | 3.8% |
| Standard Deviation (Population) | 4.3% | 3.8% |
Similar Demographics by High School Diploma
Demographics Similar to Jordanians by High School Diploma
In terms of high school diploma, the demographic groups most similar to Jordanians are Israeli (90.1%, a difference of 0.020%), Immigrants from Germany (90.2%, a difference of 0.030%), Immigrants from Hungary (90.2%, a difference of 0.040%), Immigrants from Eastern Europe (90.1%, a difference of 0.040%), and Ottawa (90.1%, a difference of 0.070%).
| Demographics | Rating | Rank | High School Diploma |
| Immigrants | Greece | 96.6 /100 | #110 | Exceptional 90.3% |
| Menominee | 96.6 /100 | #111 | Exceptional 90.3% |
| Immigrants | Belarus | 96.4 /100 | #112 | Exceptional 90.2% |
| Immigrants | Sri Lanka | 96.3 /100 | #113 | Exceptional 90.2% |
| Yugoslavians | 96.2 /100 | #114 | Exceptional 90.2% |
| Immigrants | Hungary | 95.8 /100 | #115 | Exceptional 90.2% |
| Immigrants | Germany | 95.7 /100 | #116 | Exceptional 90.2% |
| Jordanians | 95.4 /100 | #117 | Exceptional 90.2% |
| Israelis | 95.1 /100 | #118 | Exceptional 90.1% |
| Immigrants | Eastern Europe | 94.9 /100 | #119 | Exceptional 90.1% |
| Ottawa | 94.4 /100 | #120 | Exceptional 90.1% |
| Whites/Caucasians | 94.1 /100 | #121 | Exceptional 90.1% |
| Immigrants | Kazakhstan | 93.4 /100 | #122 | Exceptional 90.0% |
| German Russians | 92.0 /100 | #123 | Exceptional 90.0% |
| Mongolians | 91.6 /100 | #124 | Exceptional 89.9% |
Demographics Similar to Soviet Union by High School Diploma
In terms of high school diploma, the demographic groups most similar to Soviet Union are Alaskan Athabascan (90.9%, a difference of 0.0%), French Canadian (90.9%, a difference of 0.010%), Immigrants from Latvia (90.9%, a difference of 0.010%), Immigrants from South Central Asia (90.9%, a difference of 0.030%), and Czechoslovakian (90.9%, a difference of 0.040%).
| Demographics | Rating | Rank | High School Diploma |
| Immigrants | South Africa | 99.6 /100 | #65 | Exceptional 91.0% |
| French | 99.5 /100 | #66 | Exceptional 91.0% |
| Immigrants | Iran | 99.5 /100 | #67 | Exceptional 90.9% |
| Czechoslovakians | 99.5 /100 | #68 | Exceptional 90.9% |
| French Canadians | 99.5 /100 | #69 | Exceptional 90.9% |
| Immigrants | Latvia | 99.5 /100 | #70 | Exceptional 90.9% |
| Alaskan Athabascans | 99.4 /100 | #71 | Exceptional 90.9% |
| Soviet Union | 99.4 /100 | #72 | Exceptional 90.9% |
| Immigrants | South Central Asia | 99.4 /100 | #73 | Exceptional 90.9% |
| Immigrants | Czechoslovakia | 99.4 /100 | #74 | Exceptional 90.9% |
| Cambodians | 99.4 /100 | #75 | Exceptional 90.8% |
| Hungarians | 99.3 /100 | #76 | Exceptional 90.8% |
| Native Hawaiians | 99.3 /100 | #77 | Exceptional 90.8% |
| Burmese | 99.3 /100 | #78 | Exceptional 90.8% |
| Immigrants | Denmark | 99.3 /100 | #79 | Exceptional 90.8% |