Cypriot vs Soviet Union High School Diploma
COMPARE
Cypriot
Soviet Union
High School Diploma
High School Diploma Comparison
Cypriots
Soviet Union
91.5%
HIGH SCHOOL DIPLOMA
99.9/ 100
METRIC RATING
27th/ 347
METRIC RANK
90.9%
HIGH SCHOOL DIPLOMA
99.4/ 100
METRIC RATING
72nd/ 347
METRIC RANK
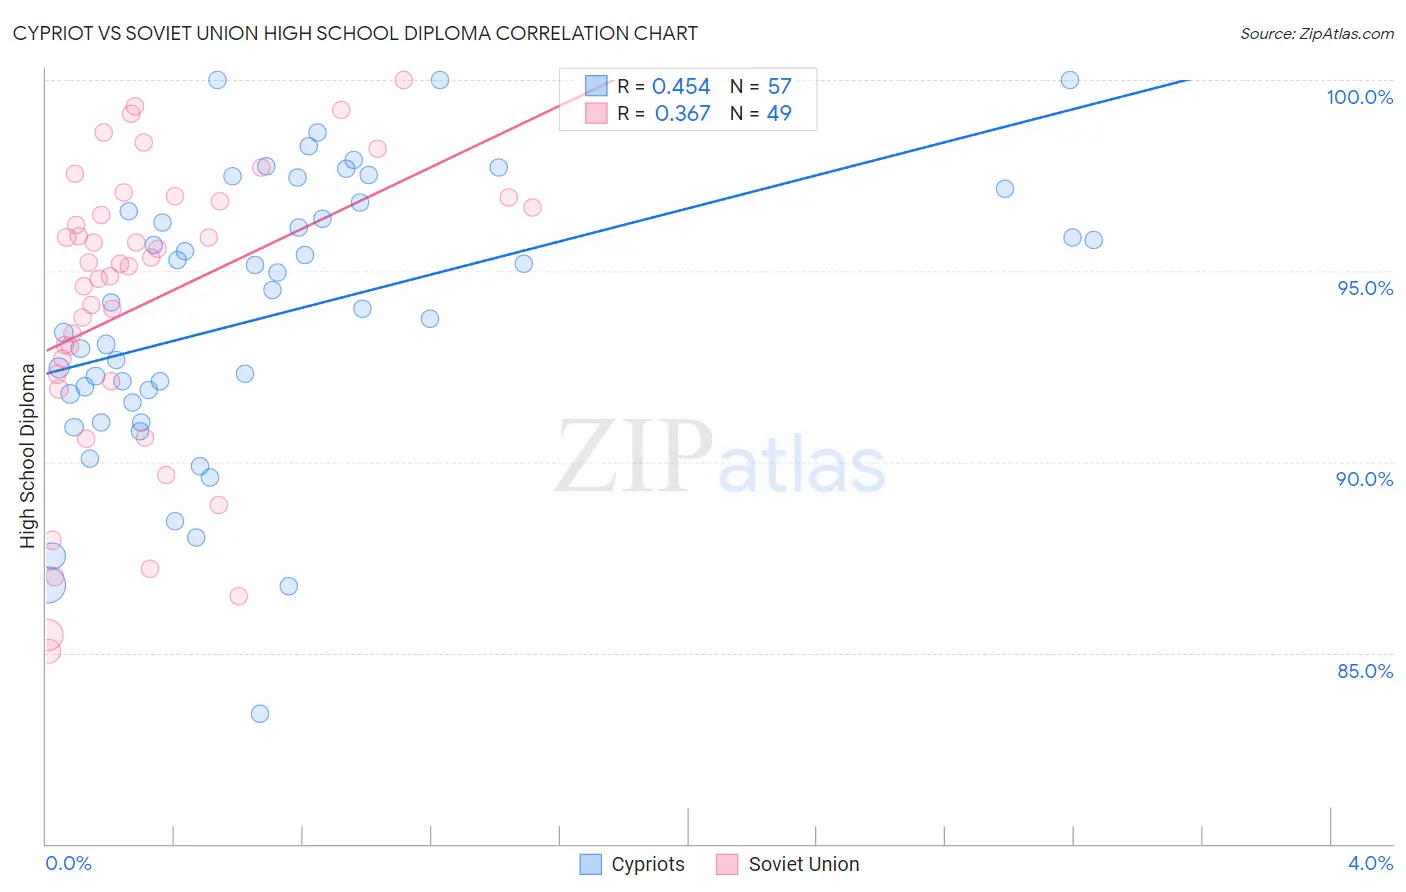
Cypriot vs Soviet Union High School Diploma Correlation Chart
The statistical analysis conducted on geographies consisting of 61,870,289 people shows a moderate positive correlation between the proportion of Cypriots and percentage of population with at least high school diploma education in the United States with a correlation coefficient (R) of 0.454 and weighted average of 91.5%. Similarly, the statistical analysis conducted on geographies consisting of 43,454,395 people shows a mild positive correlation between the proportion of Soviet Union and percentage of population with at least high school diploma education in the United States with a correlation coefficient (R) of 0.367 and weighted average of 90.9%, a difference of 0.64%.
High School Diploma Correlation Summary
| Measurement | Cypriot | Soviet Union |
| Minimum | 83.4% | 85.0% |
| Maximum | 100.0% | 100.0% |
| Range | 16.6% | 15.0% |
| Mean | 93.9% | 94.2% |
| Median | 94.2% | 95.2% |
| Interquartile 25% (IQ1) | 91.7% | 92.2% |
| Interquartile 75% (IQ3) | 96.7% | 96.9% |
| Interquartile Range (IQR) | 5.0% | 4.7% |
| Standard Deviation (Sample) | 3.7% | 3.8% |
| Standard Deviation (Population) | 3.6% | 3.8% |
Similar Demographics by High School Diploma
Demographics Similar to Cypriots by High School Diploma
In terms of high school diploma, the demographic groups most similar to Cypriots are Russian (91.5%, a difference of 0.010%), Tlingit-Haida (91.4%, a difference of 0.030%), European (91.4%, a difference of 0.050%), Thai (91.5%, a difference of 0.060%), and Iranian (91.4%, a difference of 0.060%).
| Demographics | Rating | Rank | High School Diploma |
| Czechs | 99.9 /100 | #20 | Exceptional 91.6% |
| Filipinos | 99.9 /100 | #21 | Exceptional 91.6% |
| Estonians | 99.9 /100 | #22 | Exceptional 91.6% |
| Scandinavians | 99.9 /100 | #23 | Exceptional 91.5% |
| Italians | 99.9 /100 | #24 | Exceptional 91.5% |
| Thais | 99.9 /100 | #25 | Exceptional 91.5% |
| Russians | 99.9 /100 | #26 | Exceptional 91.5% |
| Cypriots | 99.9 /100 | #27 | Exceptional 91.5% |
| Tlingit-Haida | 99.9 /100 | #28 | Exceptional 91.4% |
| Europeans | 99.9 /100 | #29 | Exceptional 91.4% |
| Iranians | 99.9 /100 | #30 | Exceptional 91.4% |
| Immigrants | Northern Europe | 99.9 /100 | #31 | Exceptional 91.4% |
| English | 99.9 /100 | #32 | Exceptional 91.4% |
| Okinawans | 99.9 /100 | #33 | Exceptional 91.4% |
| Scottish | 99.9 /100 | #34 | Exceptional 91.4% |
Demographics Similar to Soviet Union by High School Diploma
In terms of high school diploma, the demographic groups most similar to Soviet Union are Alaskan Athabascan (90.9%, a difference of 0.0%), French Canadian (90.9%, a difference of 0.010%), Immigrants from Latvia (90.9%, a difference of 0.010%), Immigrants from South Central Asia (90.9%, a difference of 0.030%), and Czechoslovakian (90.9%, a difference of 0.040%).
| Demographics | Rating | Rank | High School Diploma |
| Immigrants | South Africa | 99.6 /100 | #65 | Exceptional 91.0% |
| French | 99.5 /100 | #66 | Exceptional 91.0% |
| Immigrants | Iran | 99.5 /100 | #67 | Exceptional 90.9% |
| Czechoslovakians | 99.5 /100 | #68 | Exceptional 90.9% |
| French Canadians | 99.5 /100 | #69 | Exceptional 90.9% |
| Immigrants | Latvia | 99.5 /100 | #70 | Exceptional 90.9% |
| Alaskan Athabascans | 99.4 /100 | #71 | Exceptional 90.9% |
| Soviet Union | 99.4 /100 | #72 | Exceptional 90.9% |
| Immigrants | South Central Asia | 99.4 /100 | #73 | Exceptional 90.9% |
| Immigrants | Czechoslovakia | 99.4 /100 | #74 | Exceptional 90.9% |
| Cambodians | 99.4 /100 | #75 | Exceptional 90.8% |
| Hungarians | 99.3 /100 | #76 | Exceptional 90.8% |
| Native Hawaiians | 99.3 /100 | #77 | Exceptional 90.8% |
| Burmese | 99.3 /100 | #78 | Exceptional 90.8% |
| Immigrants | Denmark | 99.3 /100 | #79 | Exceptional 90.8% |