Ghanaian vs Immigrants from Pakistan High School Diploma
COMPARE
Ghanaian
Immigrants from Pakistan
High School Diploma
High School Diploma Comparison
Ghanaians
Immigrants from Pakistan
87.7%
HIGH SCHOOL DIPLOMA
1.4/ 100
METRIC RATING
251st/ 347
METRIC RANK
89.3%
HIGH SCHOOL DIPLOMA
62.5/ 100
METRIC RATING
158th/ 347
METRIC RANK
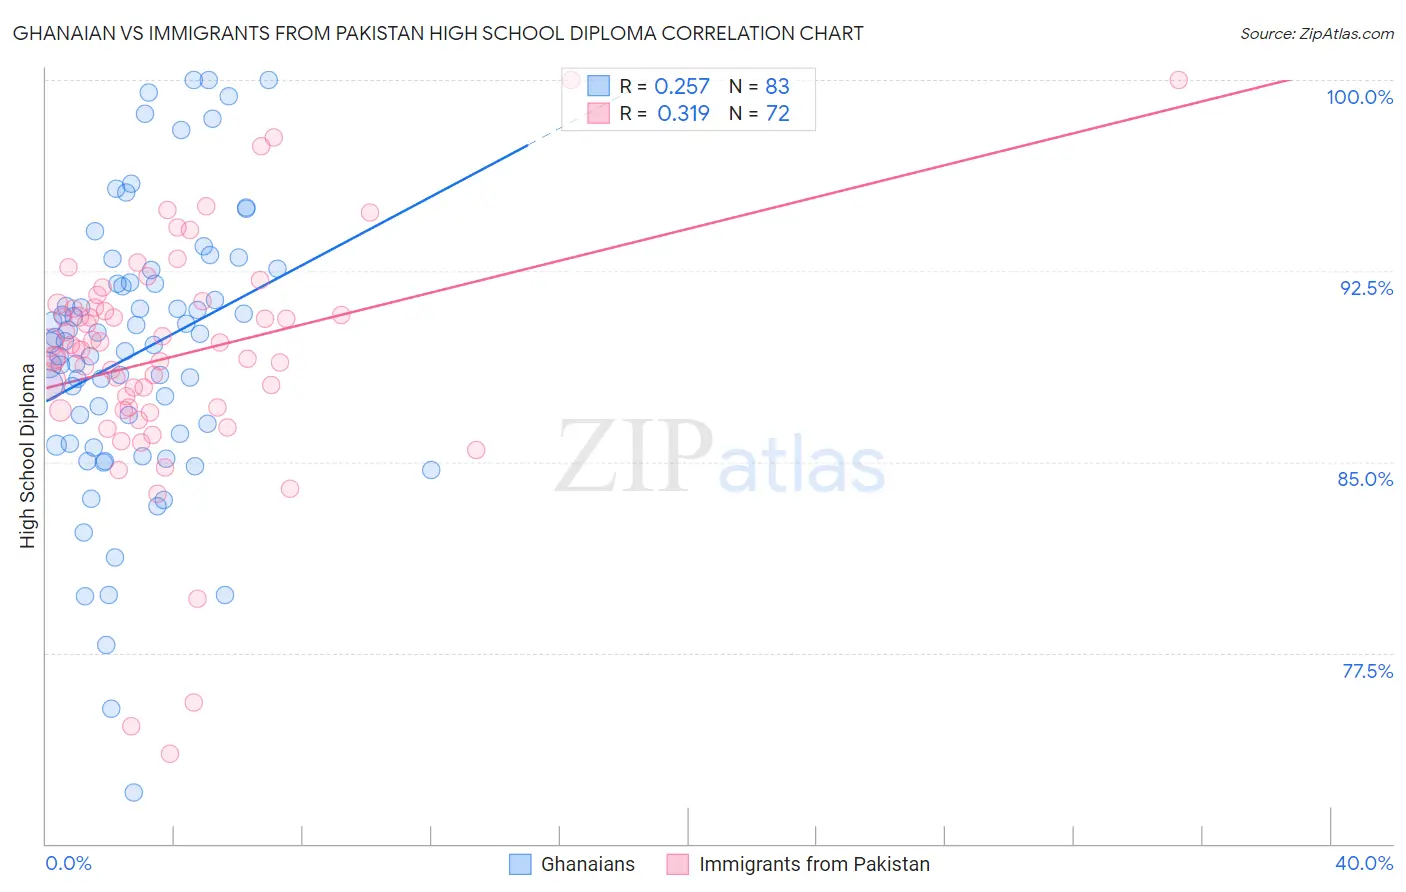
Ghanaian vs Immigrants from Pakistan High School Diploma Correlation Chart
The statistical analysis conducted on geographies consisting of 190,714,079 people shows a weak positive correlation between the proportion of Ghanaians and percentage of population with at least high school diploma education in the United States with a correlation coefficient (R) of 0.257 and weighted average of 87.7%. Similarly, the statistical analysis conducted on geographies consisting of 283,913,061 people shows a mild positive correlation between the proportion of Immigrants from Pakistan and percentage of population with at least high school diploma education in the United States with a correlation coefficient (R) of 0.319 and weighted average of 89.3%, a difference of 1.8%.
High School Diploma Correlation Summary
| Measurement | Ghanaian | Immigrants from Pakistan |
| Minimum | 72.0% | 73.5% |
| Maximum | 100.0% | 100.0% |
| Range | 28.0% | 26.5% |
| Mean | 89.3% | 89.2% |
| Median | 89.7% | 89.5% |
| Interquartile 25% (IQ1) | 85.7% | 87.1% |
| Interquartile 75% (IQ3) | 92.1% | 91.1% |
| Interquartile Range (IQR) | 6.3% | 4.1% |
| Standard Deviation (Sample) | 5.5% | 4.7% |
| Standard Deviation (Population) | 5.5% | 4.7% |
Similar Demographics by High School Diploma
Demographics Similar to Ghanaians by High School Diploma
In terms of high school diploma, the demographic groups most similar to Ghanaians are Senegalese (87.7%, a difference of 0.040%), Immigrants from Nigeria (87.7%, a difference of 0.040%), Spanish American (87.7%, a difference of 0.050%), Immigrants from South America (87.6%, a difference of 0.060%), and Immigrants from Eritrea (87.8%, a difference of 0.090%).
| Demographics | Rating | Rank | High School Diploma |
| Choctaw | 1.9 /100 | #244 | Tragic 87.8% |
| Peruvians | 1.9 /100 | #245 | Tragic 87.8% |
| Immigrants | Eritrea | 1.7 /100 | #246 | Tragic 87.8% |
| Immigrants | Costa Rica | 1.7 /100 | #247 | Tragic 87.8% |
| Spanish Americans | 1.5 /100 | #248 | Tragic 87.7% |
| Senegalese | 1.5 /100 | #249 | Tragic 87.7% |
| Immigrants | Nigeria | 1.5 /100 | #250 | Tragic 87.7% |
| Ghanaians | 1.4 /100 | #251 | Tragic 87.7% |
| Immigrants | South America | 1.2 /100 | #252 | Tragic 87.6% |
| Immigrants | Uruguay | 1.0 /100 | #253 | Tragic 87.6% |
| Immigrants | Colombia | 1.0 /100 | #254 | Tragic 87.6% |
| Immigrants | Senegal | 0.9 /100 | #255 | Tragic 87.6% |
| Africans | 0.7 /100 | #256 | Tragic 87.5% |
| Bahamians | 0.7 /100 | #257 | Tragic 87.5% |
| Immigrants | Ghana | 0.5 /100 | #258 | Tragic 87.4% |
Demographics Similar to Immigrants from Pakistan by High School Diploma
In terms of high school diploma, the demographic groups most similar to Immigrants from Pakistan are Immigrants from China (89.3%, a difference of 0.010%), Laotian (89.3%, a difference of 0.010%), Immigrants from Malaysia (89.3%, a difference of 0.020%), Brazilian (89.3%, a difference of 0.020%), and Bermudan (89.3%, a difference of 0.020%).
| Demographics | Rating | Rank | High School Diploma |
| Paraguayans | 71.4 /100 | #151 | Good 89.5% |
| Asians | 70.7 /100 | #152 | Good 89.4% |
| Immigrants | Iraq | 68.7 /100 | #153 | Good 89.4% |
| Alsatians | 66.8 /100 | #154 | Good 89.4% |
| Immigrants | Northern Africa | 66.4 /100 | #155 | Good 89.4% |
| Immigrants | Argentina | 65.5 /100 | #156 | Good 89.4% |
| Immigrants | Malaysia | 63.5 /100 | #157 | Good 89.3% |
| Immigrants | Pakistan | 62.5 /100 | #158 | Good 89.3% |
| Immigrants | China | 62.0 /100 | #159 | Good 89.3% |
| Laotians | 61.8 /100 | #160 | Good 89.3% |
| Brazilians | 61.2 /100 | #161 | Good 89.3% |
| Bermudans | 61.1 /100 | #162 | Good 89.3% |
| Cree | 61.1 /100 | #163 | Good 89.3% |
| Immigrants | Nepal | 61.1 /100 | #164 | Good 89.3% |
| Immigrants | Asia | 59.8 /100 | #165 | Average 89.3% |