Ghanaian vs Immigrants from Bolivia High School Diploma
COMPARE
Ghanaian
Immigrants from Bolivia
High School Diploma
High School Diploma Comparison
Ghanaians
Immigrants from Bolivia
87.7%
HIGH SCHOOL DIPLOMA
1.4/ 100
METRIC RATING
251st/ 347
METRIC RANK
88.4%
HIGH SCHOOL DIPLOMA
10.3/ 100
METRIC RATING
218th/ 347
METRIC RANK
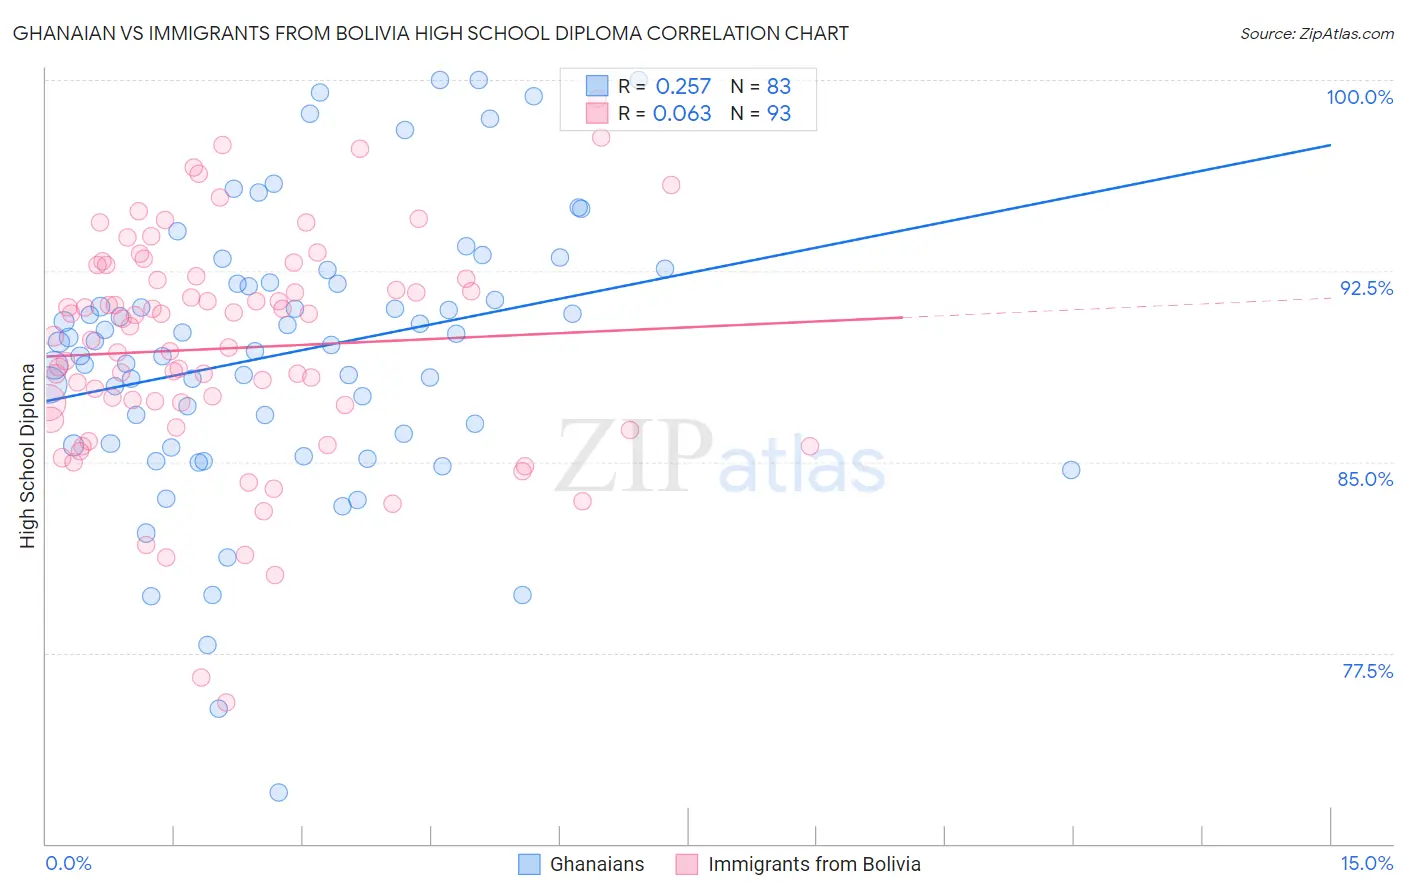
Ghanaian vs Immigrants from Bolivia High School Diploma Correlation Chart
The statistical analysis conducted on geographies consisting of 190,714,079 people shows a weak positive correlation between the proportion of Ghanaians and percentage of population with at least high school diploma education in the United States with a correlation coefficient (R) of 0.257 and weighted average of 87.7%. Similarly, the statistical analysis conducted on geographies consisting of 158,727,043 people shows a slight positive correlation between the proportion of Immigrants from Bolivia and percentage of population with at least high school diploma education in the United States with a correlation coefficient (R) of 0.063 and weighted average of 88.4%, a difference of 0.81%.
High School Diploma Correlation Summary
| Measurement | Ghanaian | Immigrants from Bolivia |
| Minimum | 72.0% | 75.5% |
| Maximum | 100.0% | 99.3% |
| Range | 28.0% | 23.7% |
| Mean | 89.3% | 89.5% |
| Median | 89.7% | 89.9% |
| Interquartile 25% (IQ1) | 85.7% | 86.9% |
| Interquartile 75% (IQ3) | 92.1% | 92.3% |
| Interquartile Range (IQR) | 6.3% | 5.3% |
| Standard Deviation (Sample) | 5.5% | 4.5% |
| Standard Deviation (Population) | 5.5% | 4.4% |
Similar Demographics by High School Diploma
Demographics Similar to Ghanaians by High School Diploma
In terms of high school diploma, the demographic groups most similar to Ghanaians are Senegalese (87.7%, a difference of 0.040%), Immigrants from Nigeria (87.7%, a difference of 0.040%), Spanish American (87.7%, a difference of 0.050%), Immigrants from South America (87.6%, a difference of 0.060%), and Immigrants from Eritrea (87.8%, a difference of 0.090%).
| Demographics | Rating | Rank | High School Diploma |
| Choctaw | 1.9 /100 | #244 | Tragic 87.8% |
| Peruvians | 1.9 /100 | #245 | Tragic 87.8% |
| Immigrants | Eritrea | 1.7 /100 | #246 | Tragic 87.8% |
| Immigrants | Costa Rica | 1.7 /100 | #247 | Tragic 87.8% |
| Spanish Americans | 1.5 /100 | #248 | Tragic 87.7% |
| Senegalese | 1.5 /100 | #249 | Tragic 87.7% |
| Immigrants | Nigeria | 1.5 /100 | #250 | Tragic 87.7% |
| Ghanaians | 1.4 /100 | #251 | Tragic 87.7% |
| Immigrants | South America | 1.2 /100 | #252 | Tragic 87.6% |
| Immigrants | Uruguay | 1.0 /100 | #253 | Tragic 87.6% |
| Immigrants | Colombia | 1.0 /100 | #254 | Tragic 87.6% |
| Immigrants | Senegal | 0.9 /100 | #255 | Tragic 87.6% |
| Africans | 0.7 /100 | #256 | Tragic 87.5% |
| Bahamians | 0.7 /100 | #257 | Tragic 87.5% |
| Immigrants | Ghana | 0.5 /100 | #258 | Tragic 87.4% |
Demographics Similar to Immigrants from Bolivia by High School Diploma
In terms of high school diploma, the demographic groups most similar to Immigrants from Bolivia are Immigrants from Africa (88.4%, a difference of 0.010%), Crow (88.4%, a difference of 0.020%), Chickasaw (88.4%, a difference of 0.020%), Immigrants from Cameroon (88.4%, a difference of 0.030%), and Costa Rican (88.4%, a difference of 0.030%).
| Demographics | Rating | Rank | High School Diploma |
| Inupiat | 13.1 /100 | #211 | Poor 88.5% |
| South American Indians | 12.2 /100 | #212 | Poor 88.5% |
| Immigrants | Somalia | 11.3 /100 | #213 | Poor 88.4% |
| Immigrants | Cameroon | 10.9 /100 | #214 | Poor 88.4% |
| Crow | 10.9 /100 | #215 | Poor 88.4% |
| Chickasaw | 10.7 /100 | #216 | Poor 88.4% |
| Immigrants | Africa | 10.6 /100 | #217 | Poor 88.4% |
| Immigrants | Bolivia | 10.3 /100 | #218 | Poor 88.4% |
| Costa Ricans | 9.6 /100 | #219 | Tragic 88.4% |
| Tongans | 9.5 /100 | #220 | Tragic 88.4% |
| Immigrants | Afghanistan | 8.6 /100 | #221 | Tragic 88.3% |
| Colville | 7.8 /100 | #222 | Tragic 88.3% |
| Immigrants | Zaire | 7.6 /100 | #223 | Tragic 88.3% |
| Shoshone | 7.0 /100 | #224 | Tragic 88.3% |
| Creek | 6.9 /100 | #225 | Tragic 88.3% |