Ghanaian vs West Indian High School Diploma
COMPARE
Ghanaian
West Indian
High School Diploma
High School Diploma Comparison
Ghanaians
West Indians
87.7%
HIGH SCHOOL DIPLOMA
1.4/ 100
METRIC RATING
251st/ 347
METRIC RANK
86.9%
HIGH SCHOOL DIPLOMA
0.1/ 100
METRIC RATING
271st/ 347
METRIC RANK
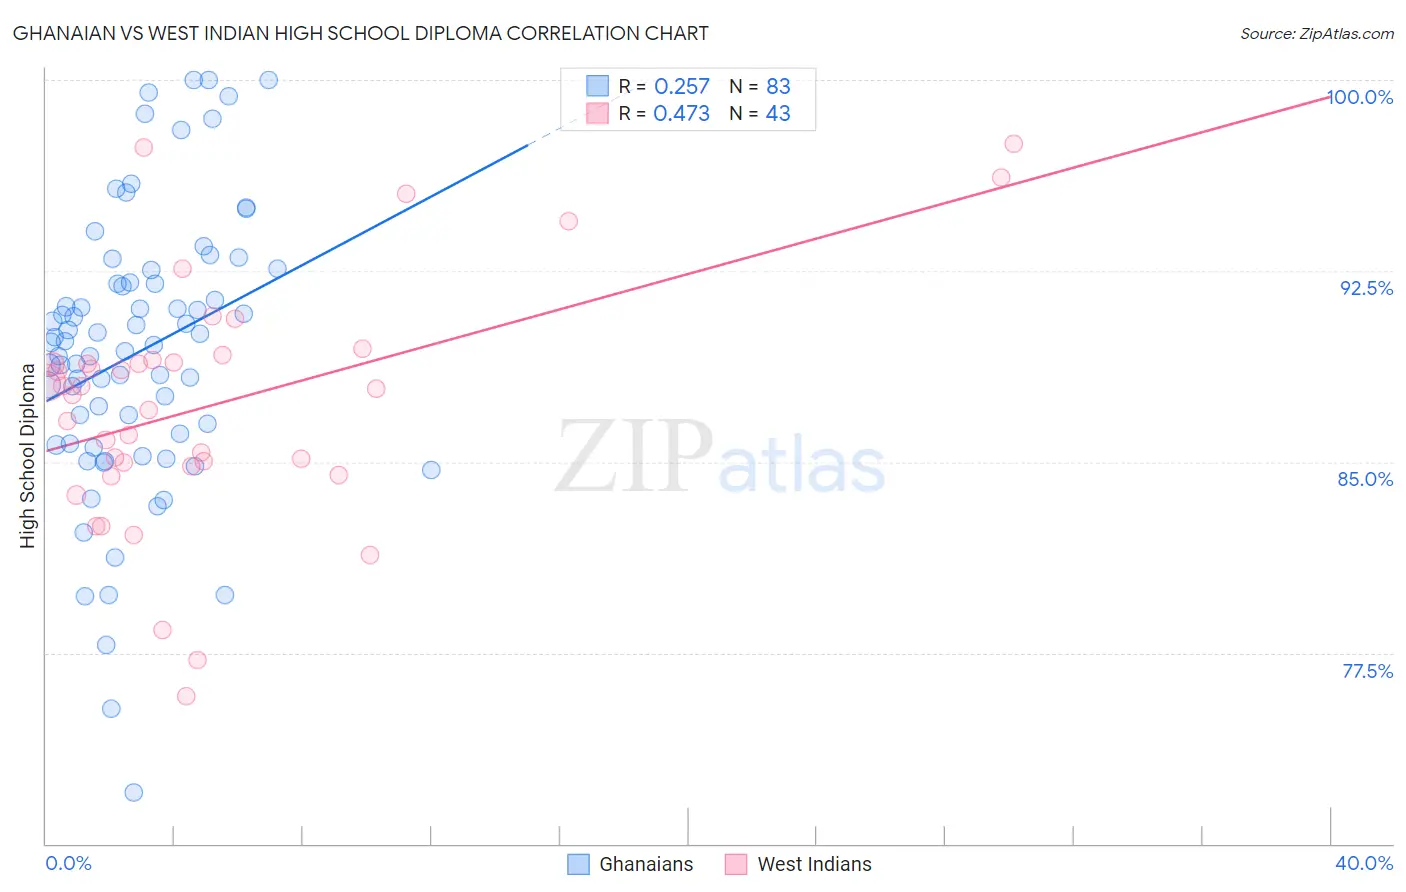
Ghanaian vs West Indian High School Diploma Correlation Chart
The statistical analysis conducted on geographies consisting of 190,714,079 people shows a weak positive correlation between the proportion of Ghanaians and percentage of population with at least high school diploma education in the United States with a correlation coefficient (R) of 0.257 and weighted average of 87.7%. Similarly, the statistical analysis conducted on geographies consisting of 254,059,006 people shows a moderate positive correlation between the proportion of West Indians and percentage of population with at least high school diploma education in the United States with a correlation coefficient (R) of 0.473 and weighted average of 86.9%, a difference of 0.89%.
High School Diploma Correlation Summary
| Measurement | Ghanaian | West Indian |
| Minimum | 72.0% | 75.8% |
| Maximum | 100.0% | 97.5% |
| Range | 28.0% | 21.7% |
| Mean | 89.3% | 87.3% |
| Median | 89.7% | 87.9% |
| Interquartile 25% (IQ1) | 85.7% | 84.8% |
| Interquartile 75% (IQ3) | 92.1% | 89.0% |
| Interquartile Range (IQR) | 6.3% | 4.2% |
| Standard Deviation (Sample) | 5.5% | 4.8% |
| Standard Deviation (Population) | 5.5% | 4.7% |
Demographics Similar to Ghanaians and West Indians by High School Diploma
In terms of high school diploma, the demographic groups most similar to Ghanaians are Immigrants from South America (87.6%, a difference of 0.060%), Immigrants from Uruguay (87.6%, a difference of 0.11%), Immigrants from Colombia (87.6%, a difference of 0.12%), Immigrants from Senegal (87.6%, a difference of 0.17%), and African (87.5%, a difference of 0.27%). Similarly, the demographic groups most similar to West Indians are Malaysian (87.0%, a difference of 0.070%), Sri Lankan (87.0%, a difference of 0.080%), Pennsylvania German (87.0%, a difference of 0.090%), Black/African American (87.0%, a difference of 0.12%), and Immigrants from Congo (87.0%, a difference of 0.13%).
| Demographics | Rating | Rank | High School Diploma |
| Ghanaians | 1.4 /100 | #251 | Tragic 87.7% |
| Immigrants | South America | 1.2 /100 | #252 | Tragic 87.6% |
| Immigrants | Uruguay | 1.0 /100 | #253 | Tragic 87.6% |
| Immigrants | Colombia | 1.0 /100 | #254 | Tragic 87.6% |
| Immigrants | Senegal | 0.9 /100 | #255 | Tragic 87.6% |
| Africans | 0.7 /100 | #256 | Tragic 87.5% |
| Bahamians | 0.7 /100 | #257 | Tragic 87.5% |
| Immigrants | Ghana | 0.5 /100 | #258 | Tragic 87.4% |
| Immigrants | Western Africa | 0.5 /100 | #259 | Tragic 87.4% |
| Cajuns | 0.4 /100 | #260 | Tragic 87.3% |
| Seminole | 0.4 /100 | #261 | Tragic 87.3% |
| Immigrants | Peru | 0.4 /100 | #262 | Tragic 87.3% |
| Immigrants | South Eastern Asia | 0.3 /100 | #263 | Tragic 87.2% |
| Jamaicans | 0.3 /100 | #264 | Tragic 87.2% |
| U.S. Virgin Islanders | 0.2 /100 | #265 | Tragic 87.1% |
| Immigrants | Congo | 0.2 /100 | #266 | Tragic 87.0% |
| Blacks/African Americans | 0.2 /100 | #267 | Tragic 87.0% |
| Pennsylvania Germans | 0.2 /100 | #268 | Tragic 87.0% |
| Sri Lankans | 0.2 /100 | #269 | Tragic 87.0% |
| Malaysians | 0.2 /100 | #270 | Tragic 87.0% |
| West Indians | 0.1 /100 | #271 | Tragic 86.9% |