Japanese vs Soviet Union High School Diploma
COMPARE
Japanese
Soviet Union
High School Diploma
High School Diploma Comparison
Japanese
Soviet Union
85.9%
HIGH SCHOOL DIPLOMA
0.0/ 100
METRIC RATING
292nd/ 347
METRIC RANK
90.9%
HIGH SCHOOL DIPLOMA
99.4/ 100
METRIC RATING
72nd/ 347
METRIC RANK
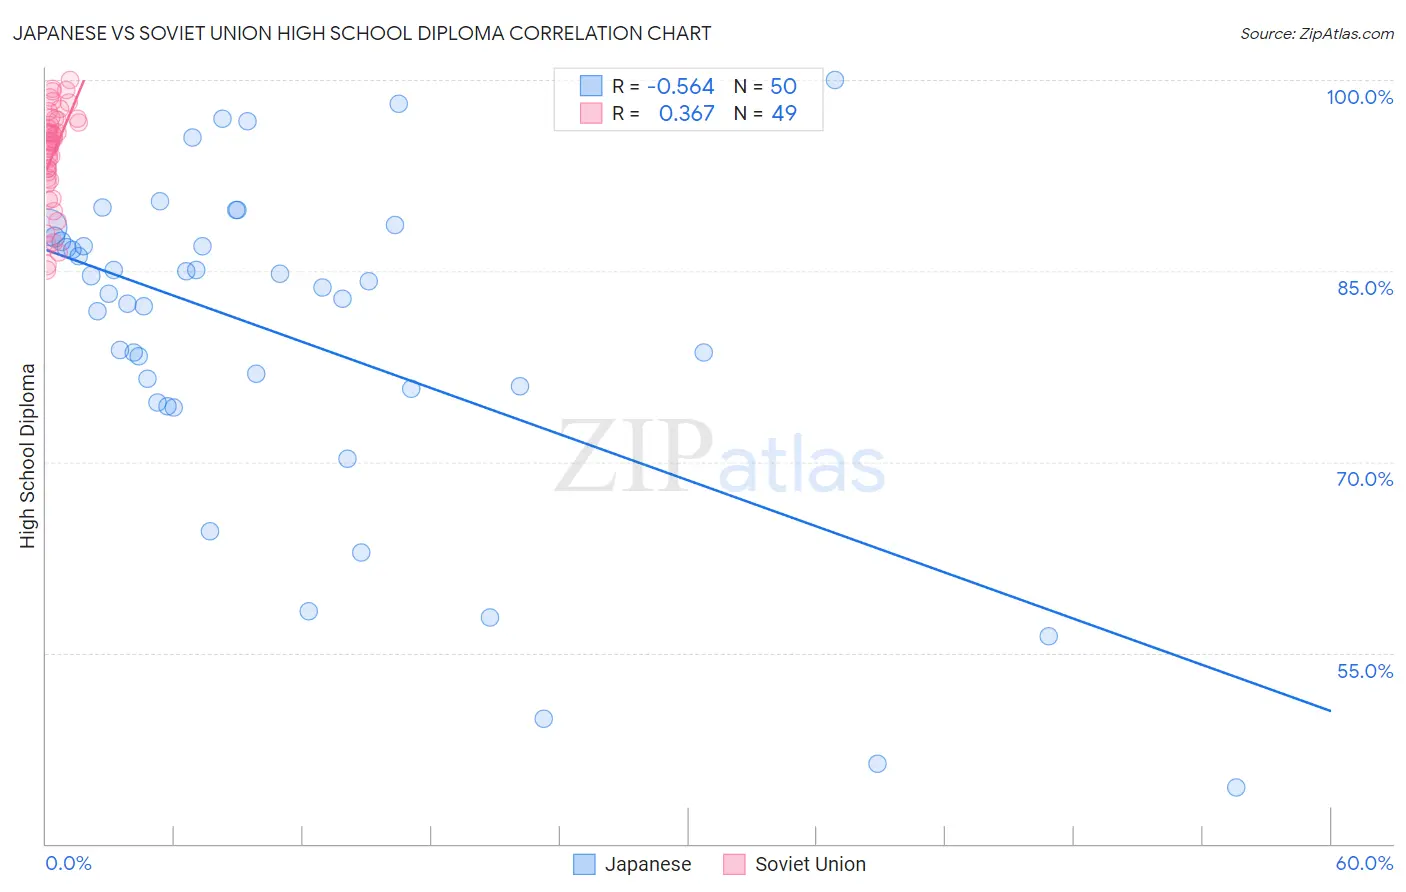
Japanese vs Soviet Union High School Diploma Correlation Chart
The statistical analysis conducted on geographies consisting of 249,183,224 people shows a substantial negative correlation between the proportion of Japanese and percentage of population with at least high school diploma education in the United States with a correlation coefficient (R) of -0.564 and weighted average of 85.9%. Similarly, the statistical analysis conducted on geographies consisting of 43,454,395 people shows a mild positive correlation between the proportion of Soviet Union and percentage of population with at least high school diploma education in the United States with a correlation coefficient (R) of 0.367 and weighted average of 90.9%, a difference of 5.8%.
High School Diploma Correlation Summary
| Measurement | Japanese | Soviet Union |
| Minimum | 44.4% | 85.0% |
| Maximum | 100.0% | 100.0% |
| Range | 55.6% | 15.0% |
| Mean | 79.8% | 94.2% |
| Median | 83.4% | 95.2% |
| Interquartile 25% (IQ1) | 75.7% | 92.2% |
| Interquartile 75% (IQ3) | 87.3% | 96.9% |
| Interquartile Range (IQR) | 11.6% | 4.7% |
| Standard Deviation (Sample) | 13.0% | 3.8% |
| Standard Deviation (Population) | 12.8% | 3.8% |
Similar Demographics by High School Diploma
Demographics Similar to Japanese by High School Diploma
In terms of high school diploma, the demographic groups most similar to Japanese are Haitian (85.9%, a difference of 0.0%), British West Indian (85.9%, a difference of 0.020%), Immigrants from Fiji (85.8%, a difference of 0.060%), Immigrants (85.8%, a difference of 0.070%), and Fijian (86.0%, a difference of 0.14%).
| Demographics | Rating | Rank | High School Diploma |
| Immigrants | West Indies | 0.0 /100 | #285 | Tragic 86.2% |
| Immigrants | St. Vincent and the Grenadines | 0.0 /100 | #286 | Tragic 86.2% |
| Ute | 0.0 /100 | #287 | Tragic 86.2% |
| Immigrants | Vietnam | 0.0 /100 | #288 | Tragic 86.2% |
| Yup'ik | 0.0 /100 | #289 | Tragic 86.1% |
| Fijians | 0.0 /100 | #290 | Tragic 86.0% |
| Haitians | 0.0 /100 | #291 | Tragic 85.9% |
| Japanese | 0.0 /100 | #292 | Tragic 85.9% |
| British West Indians | 0.0 /100 | #293 | Tragic 85.9% |
| Immigrants | Fiji | 0.0 /100 | #294 | Tragic 85.8% |
| Immigrants | Immigrants | 0.0 /100 | #295 | Tragic 85.8% |
| Immigrants | Cambodia | 0.0 /100 | #296 | Tragic 85.6% |
| Immigrants | Grenada | 0.0 /100 | #297 | Tragic 85.6% |
| Natives/Alaskans | 0.0 /100 | #298 | Tragic 85.6% |
| Guyanese | 0.0 /100 | #299 | Tragic 85.5% |
Demographics Similar to Soviet Union by High School Diploma
In terms of high school diploma, the demographic groups most similar to Soviet Union are Alaskan Athabascan (90.9%, a difference of 0.0%), French Canadian (90.9%, a difference of 0.010%), Immigrants from Latvia (90.9%, a difference of 0.010%), Immigrants from South Central Asia (90.9%, a difference of 0.030%), and Czechoslovakian (90.9%, a difference of 0.040%).
| Demographics | Rating | Rank | High School Diploma |
| Immigrants | South Africa | 99.6 /100 | #65 | Exceptional 91.0% |
| French | 99.5 /100 | #66 | Exceptional 91.0% |
| Immigrants | Iran | 99.5 /100 | #67 | Exceptional 90.9% |
| Czechoslovakians | 99.5 /100 | #68 | Exceptional 90.9% |
| French Canadians | 99.5 /100 | #69 | Exceptional 90.9% |
| Immigrants | Latvia | 99.5 /100 | #70 | Exceptional 90.9% |
| Alaskan Athabascans | 99.4 /100 | #71 | Exceptional 90.9% |
| Soviet Union | 99.4 /100 | #72 | Exceptional 90.9% |
| Immigrants | South Central Asia | 99.4 /100 | #73 | Exceptional 90.9% |
| Immigrants | Czechoslovakia | 99.4 /100 | #74 | Exceptional 90.9% |
| Cambodians | 99.4 /100 | #75 | Exceptional 90.8% |
| Hungarians | 99.3 /100 | #76 | Exceptional 90.8% |
| Native Hawaiians | 99.3 /100 | #77 | Exceptional 90.8% |
| Burmese | 99.3 /100 | #78 | Exceptional 90.8% |
| Immigrants | Denmark | 99.3 /100 | #79 | Exceptional 90.8% |