Ghanaian vs Immigrants from Caribbean High School Diploma
COMPARE
Ghanaian
Immigrants from Caribbean
High School Diploma
High School Diploma Comparison
Ghanaians
Immigrants from Caribbean
87.7%
HIGH SCHOOL DIPLOMA
1.4/ 100
METRIC RATING
251st/ 347
METRIC RANK
84.3%
HIGH SCHOOL DIPLOMA
0.0/ 100
METRIC RATING
317th/ 347
METRIC RANK
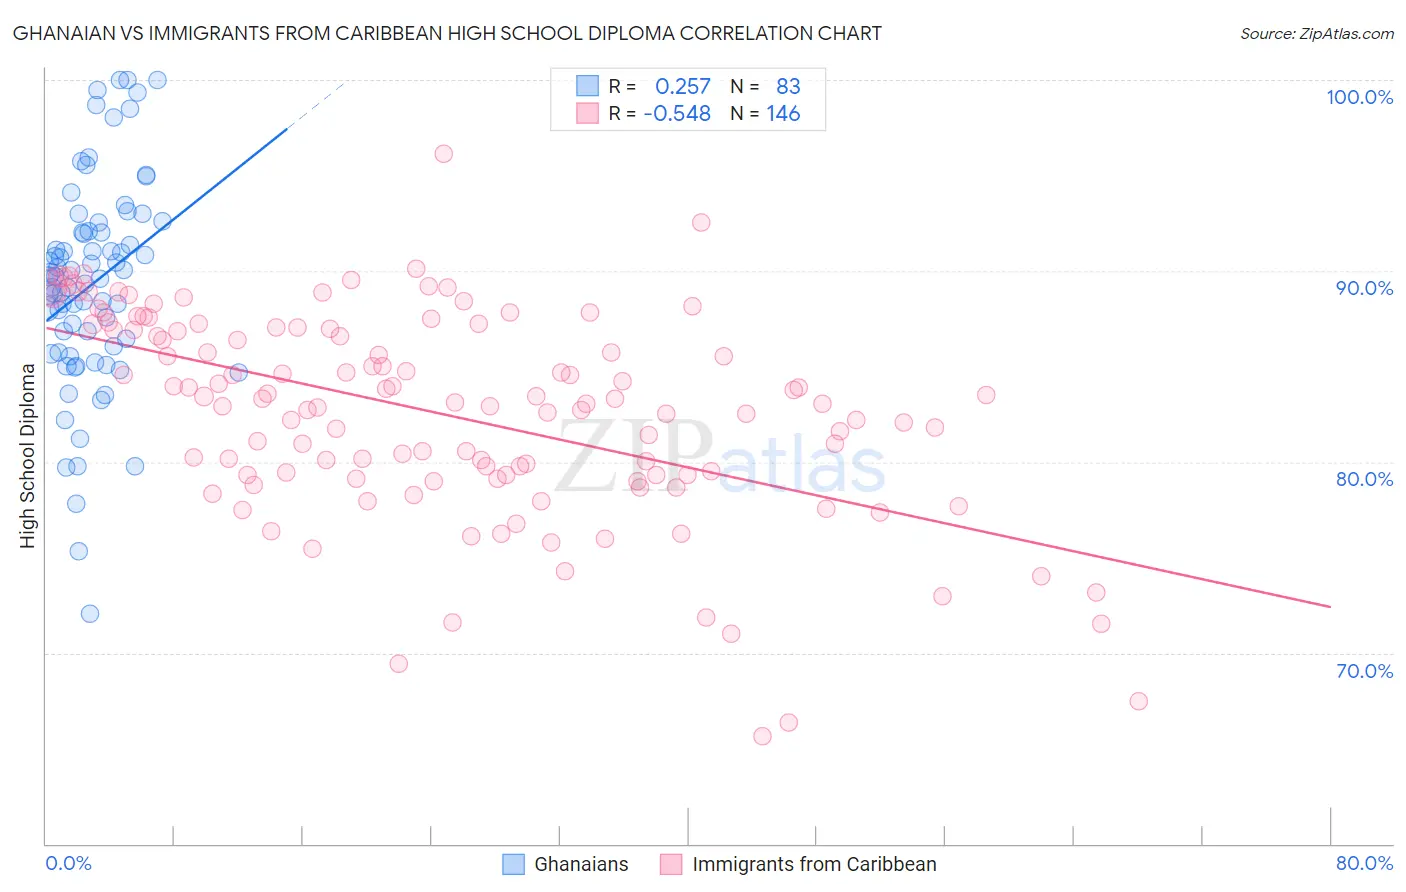
Ghanaian vs Immigrants from Caribbean High School Diploma Correlation Chart
The statistical analysis conducted on geographies consisting of 190,714,079 people shows a weak positive correlation between the proportion of Ghanaians and percentage of population with at least high school diploma education in the United States with a correlation coefficient (R) of 0.257 and weighted average of 87.7%. Similarly, the statistical analysis conducted on geographies consisting of 450,064,503 people shows a substantial negative correlation between the proportion of Immigrants from Caribbean and percentage of population with at least high school diploma education in the United States with a correlation coefficient (R) of -0.548 and weighted average of 84.3%, a difference of 4.1%.
High School Diploma Correlation Summary
| Measurement | Ghanaian | Immigrants from Caribbean |
| Minimum | 72.0% | 65.6% |
| Maximum | 100.0% | 96.2% |
| Range | 28.0% | 30.5% |
| Mean | 89.3% | 82.5% |
| Median | 89.7% | 83.1% |
| Interquartile 25% (IQ1) | 85.7% | 79.3% |
| Interquartile 75% (IQ3) | 92.1% | 87.0% |
| Interquartile Range (IQR) | 6.3% | 7.7% |
| Standard Deviation (Sample) | 5.5% | 5.4% |
| Standard Deviation (Population) | 5.5% | 5.4% |
Similar Demographics by High School Diploma
Demographics Similar to Ghanaians by High School Diploma
In terms of high school diploma, the demographic groups most similar to Ghanaians are Senegalese (87.7%, a difference of 0.040%), Immigrants from Nigeria (87.7%, a difference of 0.040%), Spanish American (87.7%, a difference of 0.050%), Immigrants from South America (87.6%, a difference of 0.060%), and Immigrants from Eritrea (87.8%, a difference of 0.090%).
| Demographics | Rating | Rank | High School Diploma |
| Choctaw | 1.9 /100 | #244 | Tragic 87.8% |
| Peruvians | 1.9 /100 | #245 | Tragic 87.8% |
| Immigrants | Eritrea | 1.7 /100 | #246 | Tragic 87.8% |
| Immigrants | Costa Rica | 1.7 /100 | #247 | Tragic 87.8% |
| Spanish Americans | 1.5 /100 | #248 | Tragic 87.7% |
| Senegalese | 1.5 /100 | #249 | Tragic 87.7% |
| Immigrants | Nigeria | 1.5 /100 | #250 | Tragic 87.7% |
| Ghanaians | 1.4 /100 | #251 | Tragic 87.7% |
| Immigrants | South America | 1.2 /100 | #252 | Tragic 87.6% |
| Immigrants | Uruguay | 1.0 /100 | #253 | Tragic 87.6% |
| Immigrants | Colombia | 1.0 /100 | #254 | Tragic 87.6% |
| Immigrants | Senegal | 0.9 /100 | #255 | Tragic 87.6% |
| Africans | 0.7 /100 | #256 | Tragic 87.5% |
| Bahamians | 0.7 /100 | #257 | Tragic 87.5% |
| Immigrants | Ghana | 0.5 /100 | #258 | Tragic 87.4% |
Demographics Similar to Immigrants from Caribbean by High School Diploma
In terms of high school diploma, the demographic groups most similar to Immigrants from Caribbean are Belizean (84.3%, a difference of 0.060%), Immigrants from Belize (84.2%, a difference of 0.070%), Central American Indian (84.2%, a difference of 0.11%), Nicaraguan (84.1%, a difference of 0.21%), and Yuman (84.0%, a difference of 0.34%).
| Demographics | Rating | Rank | High School Diploma |
| Apache | 0.0 /100 | #310 | Tragic 85.1% |
| Ecuadorians | 0.0 /100 | #311 | Tragic 85.1% |
| Cape Verdeans | 0.0 /100 | #312 | Tragic 85.1% |
| Immigrants | Ecuador | 0.0 /100 | #313 | Tragic 84.8% |
| Yaqui | 0.0 /100 | #314 | Tragic 84.7% |
| Puerto Ricans | 0.0 /100 | #315 | Tragic 84.7% |
| Belizeans | 0.0 /100 | #316 | Tragic 84.3% |
| Immigrants | Caribbean | 0.0 /100 | #317 | Tragic 84.3% |
| Immigrants | Belize | 0.0 /100 | #318 | Tragic 84.2% |
| Central American Indians | 0.0 /100 | #319 | Tragic 84.2% |
| Nicaraguans | 0.0 /100 | #320 | Tragic 84.1% |
| Yuman | 0.0 /100 | #321 | Tragic 84.0% |
| Lumbee | 0.0 /100 | #322 | Tragic 83.6% |
| Immigrants | Cuba | 0.0 /100 | #323 | Tragic 83.5% |
| Immigrants | Cabo Verde | 0.0 /100 | #324 | Tragic 83.3% |