French vs Austrian College, Under 1 year
COMPARE
French
Austrian
College, Under 1 year
College, Under 1 year Comparison
French
Austrians
65.4%
COLLEGE, UNDER 1 YEAR
48.9/ 100
METRIC RATING
176th/ 347
METRIC RANK
67.8%
COLLEGE, UNDER 1 YEAR
96.4/ 100
METRIC RATING
107th/ 347
METRIC RANK
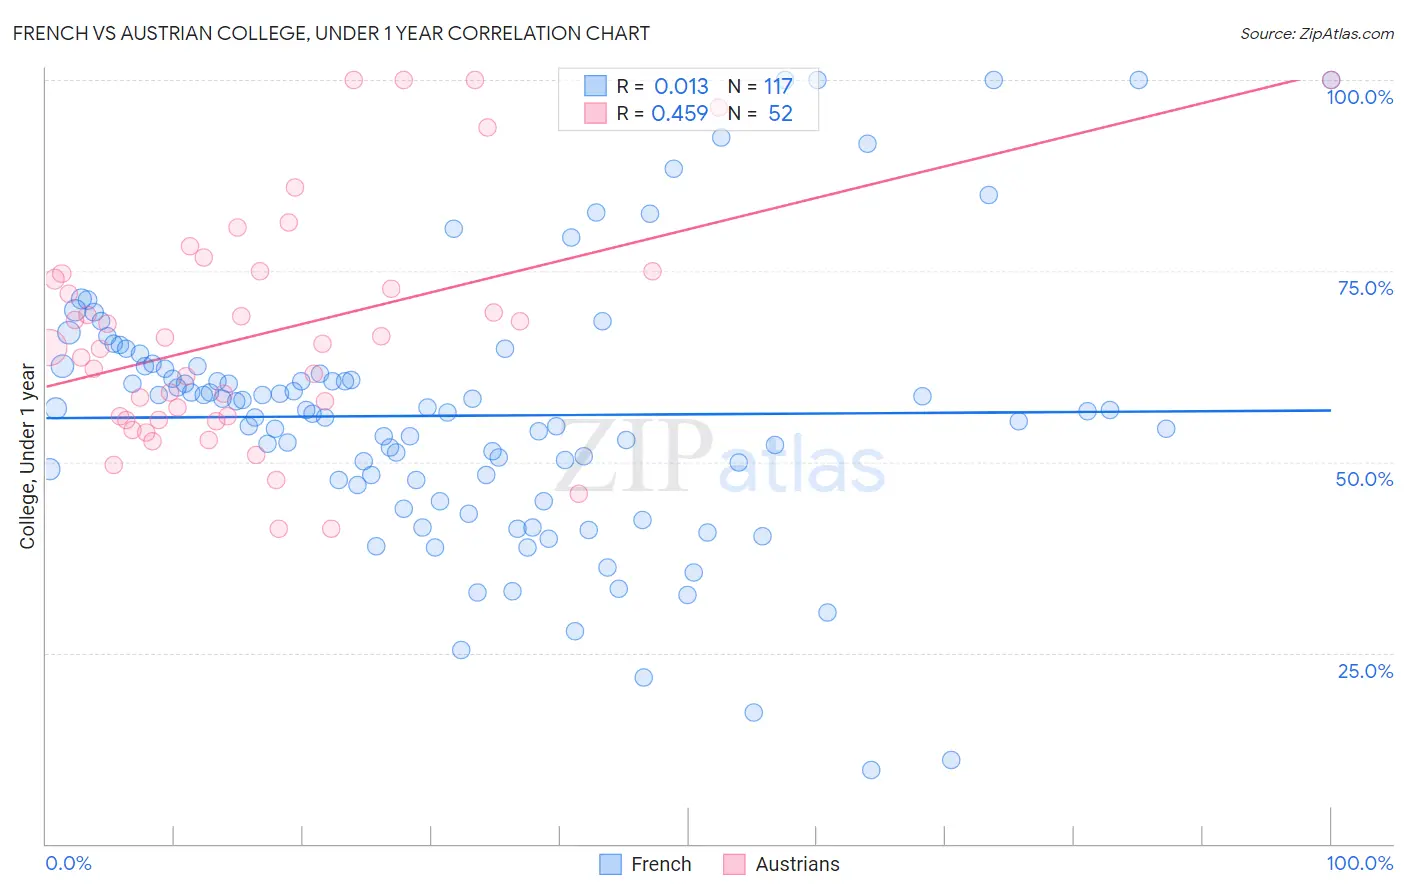
French vs Austrian College, Under 1 year Correlation Chart
The statistical analysis conducted on geographies consisting of 572,421,554 people shows no correlation between the proportion of French and percentage of population with at least college, under 1 year education in the United States with a correlation coefficient (R) of 0.013 and weighted average of 65.4%. Similarly, the statistical analysis conducted on geographies consisting of 452,079,240 people shows a moderate positive correlation between the proportion of Austrians and percentage of population with at least college, under 1 year education in the United States with a correlation coefficient (R) of 0.459 and weighted average of 67.8%, a difference of 3.7%.
College, Under 1 year Correlation Summary
| Measurement | French | Austrian |
| Minimum | 9.7% | 41.2% |
| Maximum | 100.0% | 100.0% |
| Range | 90.3% | 58.8% |
| Mean | 56.0% | 67.0% |
| Median | 56.6% | 65.2% |
| Interquartile 25% (IQ1) | 47.3% | 55.7% |
| Interquartile 75% (IQ3) | 62.5% | 74.8% |
| Interquartile Range (IQR) | 15.2% | 19.1% |
| Standard Deviation (Sample) | 17.4% | 15.2% |
| Standard Deviation (Population) | 17.3% | 15.1% |
Similar Demographics by College, Under 1 year
Demographics Similar to French by College, Under 1 year
In terms of college, under 1 year, the demographic groups most similar to French are Immigrants from North Macedonia (65.4%, a difference of 0.010%), Scotch-Irish (65.4%, a difference of 0.030%), German Russian (65.4%, a difference of 0.030%), Guamanian/Chamorro (65.4%, a difference of 0.030%), and Immigrants from Bosnia and Herzegovina (65.4%, a difference of 0.050%).
| Demographics | Rating | Rank | College, Under 1 year |
| Yugoslavians | 55.7 /100 | #169 | Average 65.6% |
| Germans | 55.7 /100 | #170 | Average 65.6% |
| Immigrants | Oceania | 55.0 /100 | #171 | Average 65.6% |
| South American Indians | 54.4 /100 | #172 | Average 65.5% |
| Swiss | 53.9 /100 | #173 | Average 65.5% |
| Immigrants | Bosnia and Herzegovina | 50.0 /100 | #174 | Average 65.4% |
| Scotch-Irish | 49.5 /100 | #175 | Average 65.4% |
| French | 48.9 /100 | #176 | Average 65.4% |
| Immigrants | North Macedonia | 48.6 /100 | #177 | Average 65.4% |
| German Russians | 48.3 /100 | #178 | Average 65.4% |
| Guamanians/Chamorros | 48.2 /100 | #179 | Average 65.4% |
| Dutch | 46.1 /100 | #180 | Average 65.3% |
| Spaniards | 45.5 /100 | #181 | Average 65.3% |
| Immigrants | Africa | 44.7 /100 | #182 | Average 65.3% |
| Immigrants | Poland | 42.6 /100 | #183 | Average 65.2% |
Demographics Similar to Austrians by College, Under 1 year
In terms of college, under 1 year, the demographic groups most similar to Austrians are Immigrants from Croatia (67.8%, a difference of 0.060%), Immigrants from Western Asia (67.8%, a difference of 0.070%), Afghan (67.8%, a difference of 0.070%), Immigrants from Egypt (67.7%, a difference of 0.12%), and Carpatho Rusyn (67.9%, a difference of 0.14%).
| Demographics | Rating | Rank | College, Under 1 year |
| Immigrants | Argentina | 97.0 /100 | #100 | Exceptional 67.9% |
| Immigrants | Eastern Europe | 96.9 /100 | #101 | Exceptional 67.9% |
| Palestinians | 96.9 /100 | #102 | Exceptional 67.9% |
| Carpatho Rusyns | 96.8 /100 | #103 | Exceptional 67.9% |
| Immigrants | Western Asia | 96.6 /100 | #104 | Exceptional 67.8% |
| Afghans | 96.6 /100 | #105 | Exceptional 67.8% |
| Immigrants | Croatia | 96.6 /100 | #106 | Exceptional 67.8% |
| Austrians | 96.4 /100 | #107 | Exceptional 67.8% |
| Immigrants | Egypt | 96.0 /100 | #108 | Exceptional 67.7% |
| Scandinavians | 95.8 /100 | #109 | Exceptional 67.7% |
| Assyrians/Chaldeans/Syriacs | 95.8 /100 | #110 | Exceptional 67.7% |
| Ukrainians | 95.8 /100 | #111 | Exceptional 67.7% |
| Macedonians | 95.7 /100 | #112 | Exceptional 67.6% |
| Syrians | 95.6 /100 | #113 | Exceptional 67.6% |
| Chileans | 95.3 /100 | #114 | Exceptional 67.6% |