French vs Immigrants from Laos Average Family Size
COMPARE
French
Immigrants from Laos
Average Family Size
Average Family Size Comparison
French
Immigrants from Laos
3.10
AVERAGE FAMILY SIZE
0.0/ 100
METRIC RATING
338th/ 347
METRIC RANK
3.34
AVERAGE FAMILY SIZE
99.9/ 100
METRIC RATING
65th/ 347
METRIC RANK
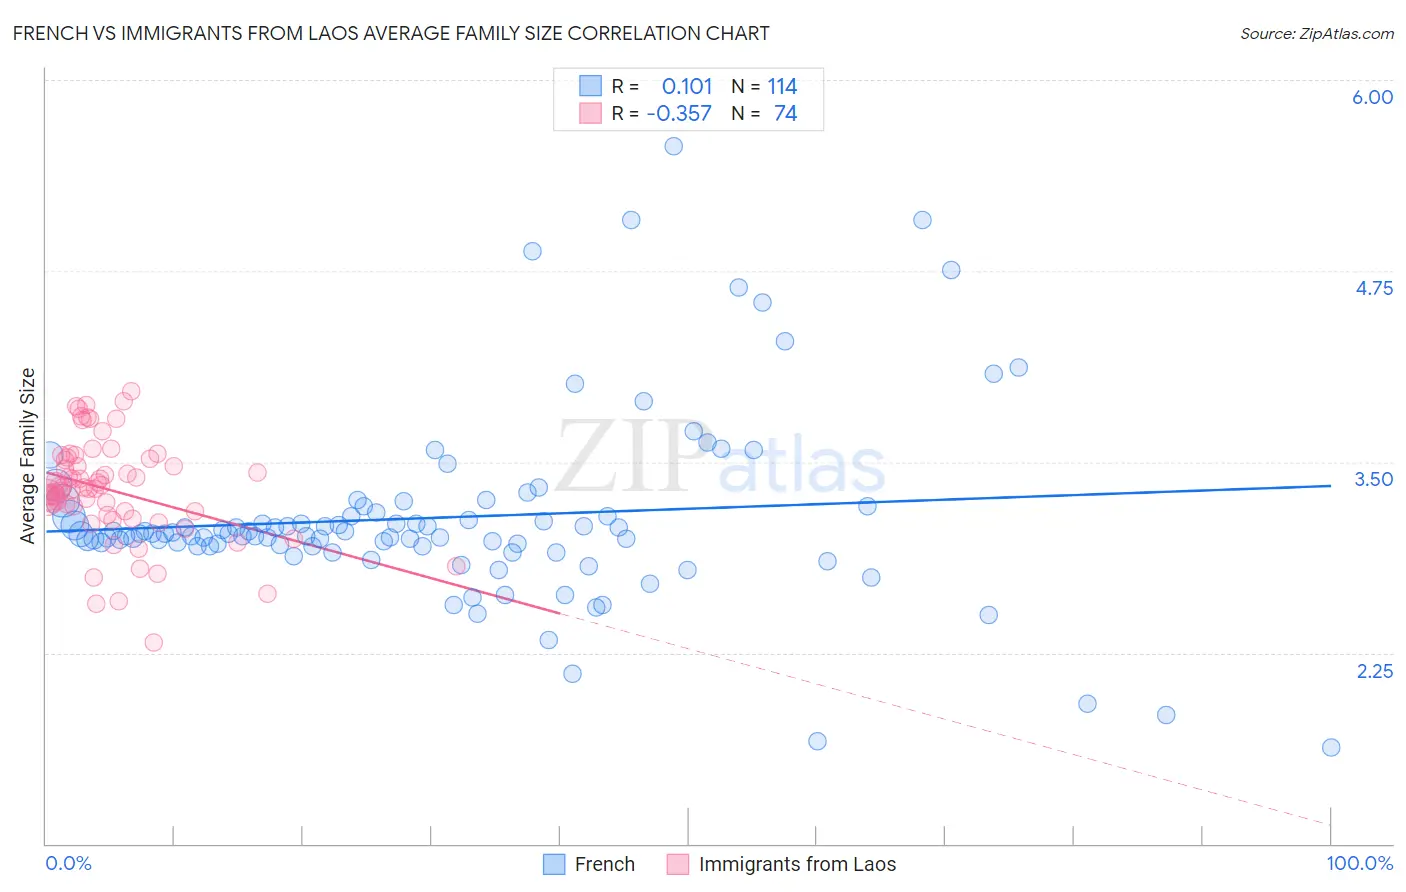
French vs Immigrants from Laos Average Family Size Correlation Chart
The statistical analysis conducted on geographies consisting of 571,815,188 people shows a poor positive correlation between the proportion of French and average family size in the United States with a correlation coefficient (R) of 0.101 and weighted average of 3.10. Similarly, the statistical analysis conducted on geographies consisting of 201,468,648 people shows a mild negative correlation between the proportion of Immigrants from Laos and average family size in the United States with a correlation coefficient (R) of -0.357 and weighted average of 3.34, a difference of 7.7%.
Average Family Size Correlation Summary
| Measurement | French | Immigrants from Laos |
| Minimum | 1.63 | 2.32 |
| Maximum | 5.57 | 3.96 |
| Range | 3.94 | 1.64 |
| Mean | 3.14 | 3.32 |
| Median | 3.03 | 3.33 |
| Interquartile 25% (IQ1) | 2.95 | 3.18 |
| Interquartile 75% (IQ3) | 3.17 | 3.52 |
| Interquartile Range (IQR) | 0.22 | 0.34 |
| Standard Deviation (Sample) | 0.62 | 0.33 |
| Standard Deviation (Population) | 0.62 | 0.33 |
Similar Demographics by Average Family Size
Demographics Similar to French by Average Family Size
In terms of average family size, the demographic groups most similar to French are Croatian (3.10, a difference of 0.010%), Swedish (3.10, a difference of 0.020%), Irish (3.10, a difference of 0.060%), Luxembourger (3.10, a difference of 0.12%), and Estonian (3.10, a difference of 0.15%).
| Demographics | Rating | Rank | Average Family Size |
| Scotch-Irish | 0.0 /100 | #331 | Tragic 3.11 |
| Scottish | 0.0 /100 | #332 | Tragic 3.11 |
| Estonians | 0.0 /100 | #333 | Tragic 3.10 |
| Lithuanians | 0.0 /100 | #334 | Tragic 3.10 |
| Luxembourgers | 0.0 /100 | #335 | Tragic 3.10 |
| Irish | 0.0 /100 | #336 | Tragic 3.10 |
| Swedes | 0.0 /100 | #337 | Tragic 3.10 |
| French | 0.0 /100 | #338 | Tragic 3.10 |
| Croatians | 0.0 /100 | #339 | Tragic 3.10 |
| Finns | 0.0 /100 | #340 | Tragic 3.09 |
| Poles | 0.0 /100 | #341 | Tragic 3.09 |
| Germans | 0.0 /100 | #342 | Tragic 3.09 |
| Norwegians | 0.0 /100 | #343 | Tragic 3.08 |
| French Canadians | 0.0 /100 | #344 | Tragic 3.07 |
| Slovenes | 0.0 /100 | #345 | Tragic 3.07 |
Demographics Similar to Immigrants from Laos by Average Family Size
In terms of average family size, the demographic groups most similar to Immigrants from Laos are Dominican (3.34, a difference of 0.020%), Immigrants from St. Vincent and the Grenadines (3.34, a difference of 0.060%), Chinese (3.34, a difference of 0.090%), Immigrants from Jamaica (3.33, a difference of 0.10%), and Immigrants from Grenada (3.34, a difference of 0.11%).
| Demographics | Rating | Rank | Average Family Size |
| Hondurans | 100.0 /100 | #58 | Exceptional 3.35 |
| Japanese | 100.0 /100 | #59 | Exceptional 3.35 |
| Immigrants | Armenia | 100.0 /100 | #60 | Exceptional 3.35 |
| Central American Indians | 100.0 /100 | #61 | Exceptional 3.35 |
| Immigrants | Grenada | 100.0 /100 | #62 | Exceptional 3.34 |
| Chinese | 100.0 /100 | #63 | Exceptional 3.34 |
| Dominicans | 99.9 /100 | #64 | Exceptional 3.34 |
| Immigrants | Laos | 99.9 /100 | #65 | Exceptional 3.34 |
| Immigrants | St. Vincent and the Grenadines | 99.9 /100 | #66 | Exceptional 3.34 |
| Immigrants | Jamaica | 99.9 /100 | #67 | Exceptional 3.33 |
| Immigrants | Cambodia | 99.9 /100 | #68 | Exceptional 3.33 |
| Immigrants | Immigrants | 99.9 /100 | #69 | Exceptional 3.33 |
| Immigrants | Trinidad and Tobago | 99.9 /100 | #70 | Exceptional 3.33 |
| Immigrants | West Indies | 99.9 /100 | #71 | Exceptional 3.33 |
| Immigrants | Caribbean | 99.9 /100 | #72 | Exceptional 3.33 |