French vs Lumbee College, Under 1 year
COMPARE
French
Lumbee
College, Under 1 year
College, Under 1 year Comparison
French
Lumbee
65.4%
COLLEGE, UNDER 1 YEAR
48.9/ 100
METRIC RATING
176th/ 347
METRIC RANK
54.2%
COLLEGE, UNDER 1 YEAR
0.0/ 100
METRIC RATING
338th/ 347
METRIC RANK
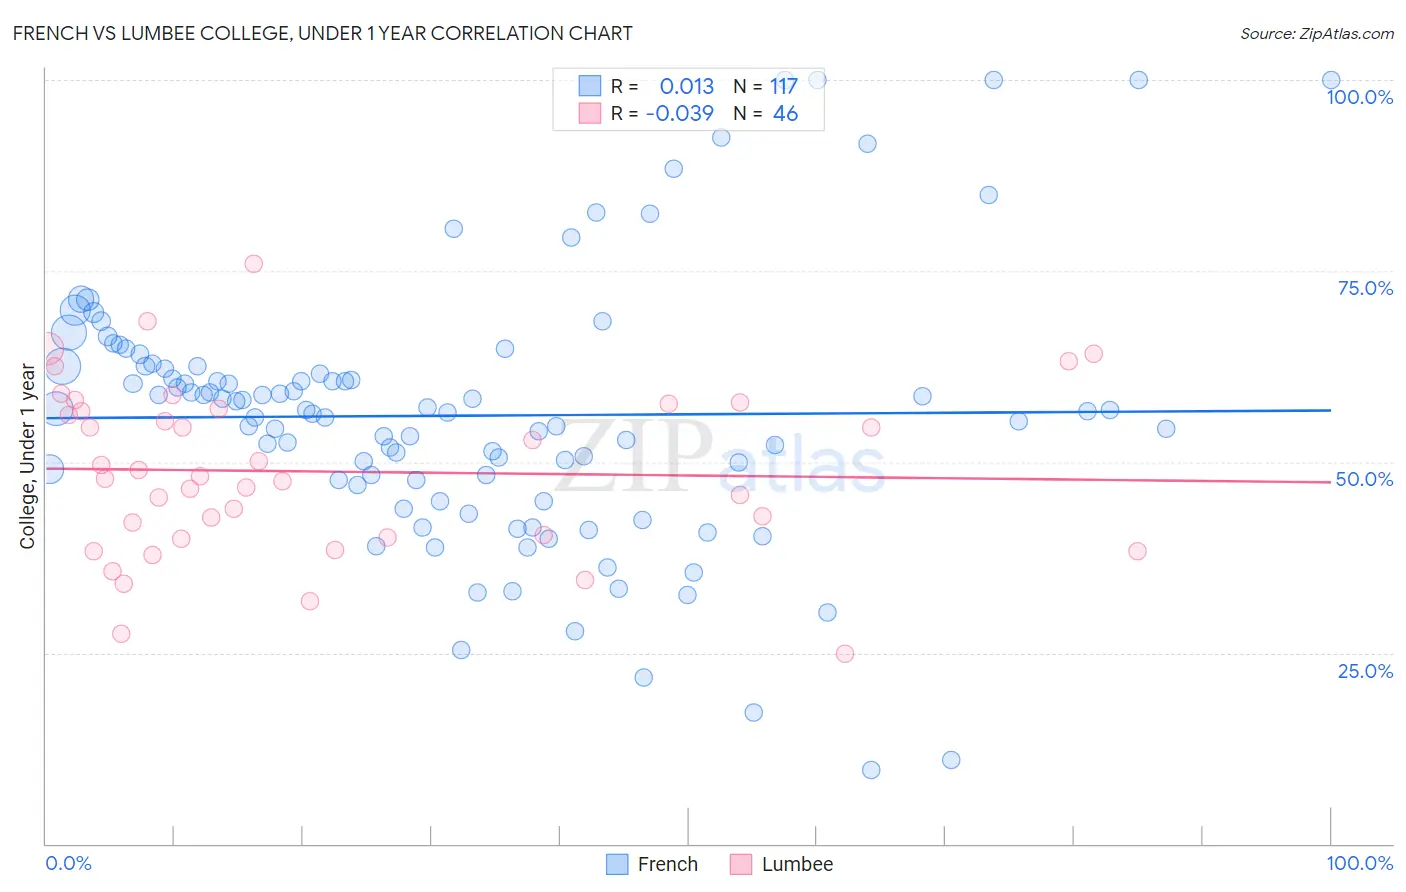
French vs Lumbee College, Under 1 year Correlation Chart
The statistical analysis conducted on geographies consisting of 572,421,554 people shows no correlation between the proportion of French and percentage of population with at least college, under 1 year education in the United States with a correlation coefficient (R) of 0.013 and weighted average of 65.4%. Similarly, the statistical analysis conducted on geographies consisting of 92,299,068 people shows no correlation between the proportion of Lumbee and percentage of population with at least college, under 1 year education in the United States with a correlation coefficient (R) of -0.039 and weighted average of 54.2%, a difference of 20.6%.
College, Under 1 year Correlation Summary
| Measurement | French | Lumbee |
| Minimum | 9.7% | 24.8% |
| Maximum | 100.0% | 75.9% |
| Range | 90.3% | 51.1% |
| Mean | 56.0% | 48.7% |
| Median | 56.6% | 47.9% |
| Interquartile 25% (IQ1) | 47.3% | 40.0% |
| Interquartile 75% (IQ3) | 62.5% | 56.9% |
| Interquartile Range (IQR) | 15.2% | 16.9% |
| Standard Deviation (Sample) | 17.4% | 11.1% |
| Standard Deviation (Population) | 17.3% | 11.0% |
Similar Demographics by College, Under 1 year
Demographics Similar to French by College, Under 1 year
In terms of college, under 1 year, the demographic groups most similar to French are Immigrants from North Macedonia (65.4%, a difference of 0.010%), Scotch-Irish (65.4%, a difference of 0.030%), German Russian (65.4%, a difference of 0.030%), Guamanian/Chamorro (65.4%, a difference of 0.030%), and Immigrants from Bosnia and Herzegovina (65.4%, a difference of 0.050%).
| Demographics | Rating | Rank | College, Under 1 year |
| Yugoslavians | 55.7 /100 | #169 | Average 65.6% |
| Germans | 55.7 /100 | #170 | Average 65.6% |
| Immigrants | Oceania | 55.0 /100 | #171 | Average 65.6% |
| South American Indians | 54.4 /100 | #172 | Average 65.5% |
| Swiss | 53.9 /100 | #173 | Average 65.5% |
| Immigrants | Bosnia and Herzegovina | 50.0 /100 | #174 | Average 65.4% |
| Scotch-Irish | 49.5 /100 | #175 | Average 65.4% |
| French | 48.9 /100 | #176 | Average 65.4% |
| Immigrants | North Macedonia | 48.6 /100 | #177 | Average 65.4% |
| German Russians | 48.3 /100 | #178 | Average 65.4% |
| Guamanians/Chamorros | 48.2 /100 | #179 | Average 65.4% |
| Dutch | 46.1 /100 | #180 | Average 65.3% |
| Spaniards | 45.5 /100 | #181 | Average 65.3% |
| Immigrants | Africa | 44.7 /100 | #182 | Average 65.3% |
| Immigrants | Poland | 42.6 /100 | #183 | Average 65.2% |
Demographics Similar to Lumbee by College, Under 1 year
In terms of college, under 1 year, the demographic groups most similar to Lumbee are Immigrants from Dominican Republic (54.0%, a difference of 0.40%), Immigrants from Central America (54.4%, a difference of 0.41%), Spanish American Indian (54.0%, a difference of 0.49%), Pennsylvania German (54.5%, a difference of 0.56%), and Inupiat (54.6%, a difference of 0.73%).
| Demographics | Rating | Rank | College, Under 1 year |
| Dominicans | 0.0 /100 | #331 | Tragic 55.5% |
| Immigrants | Yemen | 0.0 /100 | #332 | Tragic 55.3% |
| Yuman | 0.0 /100 | #333 | Tragic 55.1% |
| Immigrants | Azores | 0.0 /100 | #334 | Tragic 54.7% |
| Inupiat | 0.0 /100 | #335 | Tragic 54.6% |
| Pennsylvania Germans | 0.0 /100 | #336 | Tragic 54.5% |
| Immigrants | Central America | 0.0 /100 | #337 | Tragic 54.4% |
| Lumbee | 0.0 /100 | #338 | Tragic 54.2% |
| Immigrants | Dominican Republic | 0.0 /100 | #339 | Tragic 54.0% |
| Spanish American Indians | 0.0 /100 | #340 | Tragic 54.0% |
| Immigrants | Cabo Verde | 0.0 /100 | #341 | Tragic 53.7% |
| Immigrants | Mexico | 0.0 /100 | #342 | Tragic 53.7% |
| Tohono O'odham | 0.0 /100 | #343 | Tragic 52.8% |
| Yakama | 0.0 /100 | #344 | Tragic 52.6% |
| Pima | 0.0 /100 | #345 | Tragic 51.4% |