French vs Immigrants from Northern Europe College, Under 1 year
COMPARE
French
Immigrants from Northern Europe
College, Under 1 year
College, Under 1 year Comparison
French
Immigrants from Northern Europe
65.4%
COLLEGE, UNDER 1 YEAR
48.9/ 100
METRIC RATING
176th/ 347
METRIC RANK
71.1%
COLLEGE, UNDER 1 YEAR
100.0/ 100
METRIC RATING
23rd/ 347
METRIC RANK
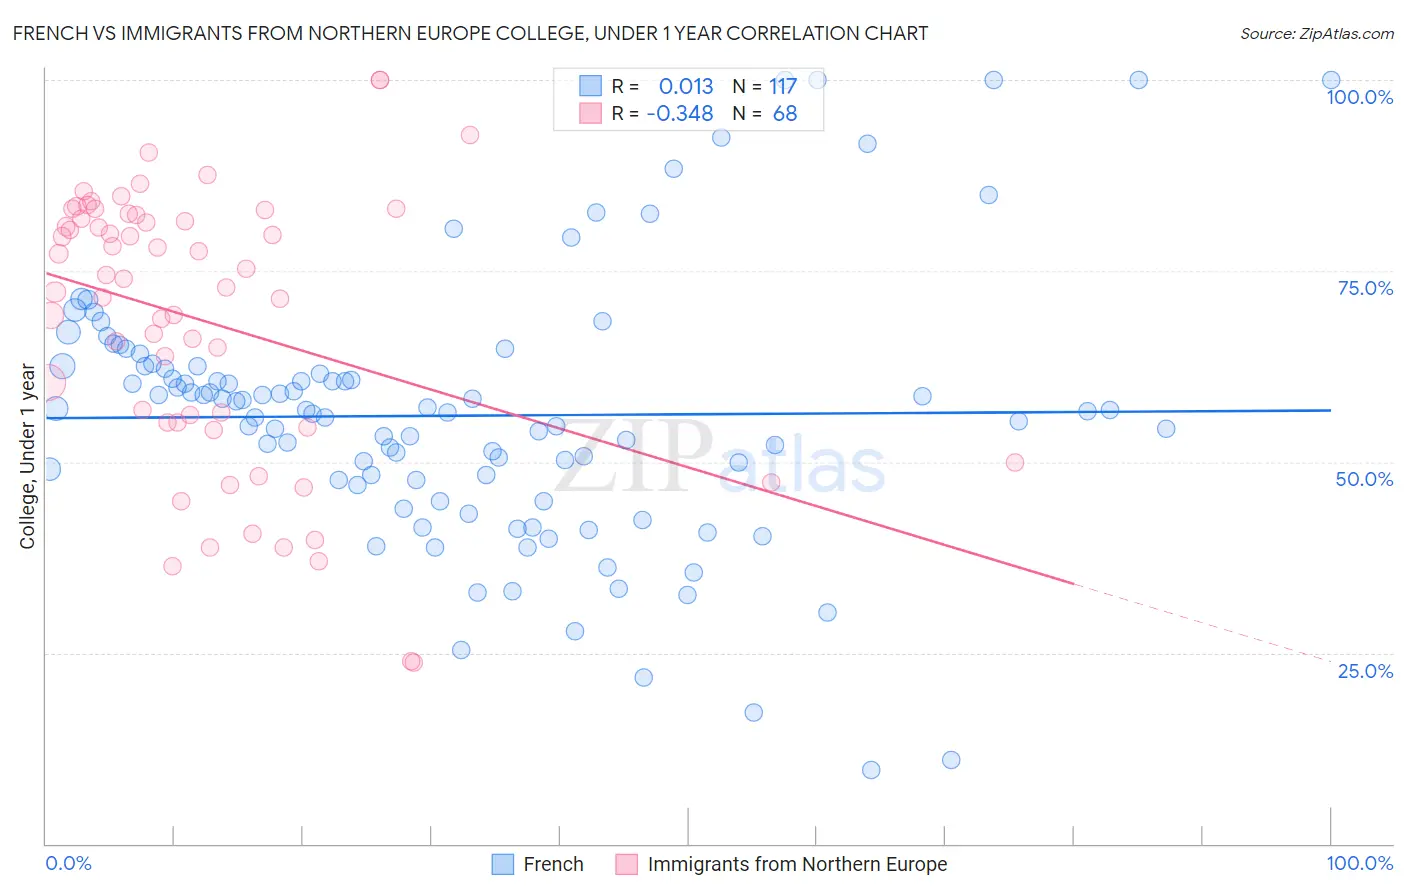
French vs Immigrants from Northern Europe College, Under 1 year Correlation Chart
The statistical analysis conducted on geographies consisting of 572,421,554 people shows no correlation between the proportion of French and percentage of population with at least college, under 1 year education in the United States with a correlation coefficient (R) of 0.013 and weighted average of 65.4%. Similarly, the statistical analysis conducted on geographies consisting of 477,223,087 people shows a mild negative correlation between the proportion of Immigrants from Northern Europe and percentage of population with at least college, under 1 year education in the United States with a correlation coefficient (R) of -0.348 and weighted average of 71.1%, a difference of 8.8%.
College, Under 1 year Correlation Summary
| Measurement | French | Immigrants from Northern Europe |
| Minimum | 9.7% | 23.8% |
| Maximum | 100.0% | 100.0% |
| Range | 90.3% | 76.2% |
| Mean | 56.0% | 68.4% |
| Median | 56.6% | 73.4% |
| Interquartile 25% (IQ1) | 47.3% | 55.1% |
| Interquartile 75% (IQ3) | 62.5% | 82.0% |
| Interquartile Range (IQR) | 15.2% | 26.9% |
| Standard Deviation (Sample) | 17.4% | 18.0% |
| Standard Deviation (Population) | 17.3% | 17.8% |
Similar Demographics by College, Under 1 year
Demographics Similar to French by College, Under 1 year
In terms of college, under 1 year, the demographic groups most similar to French are Immigrants from North Macedonia (65.4%, a difference of 0.010%), Scotch-Irish (65.4%, a difference of 0.030%), German Russian (65.4%, a difference of 0.030%), Guamanian/Chamorro (65.4%, a difference of 0.030%), and Immigrants from Bosnia and Herzegovina (65.4%, a difference of 0.050%).
| Demographics | Rating | Rank | College, Under 1 year |
| Yugoslavians | 55.7 /100 | #169 | Average 65.6% |
| Germans | 55.7 /100 | #170 | Average 65.6% |
| Immigrants | Oceania | 55.0 /100 | #171 | Average 65.6% |
| South American Indians | 54.4 /100 | #172 | Average 65.5% |
| Swiss | 53.9 /100 | #173 | Average 65.5% |
| Immigrants | Bosnia and Herzegovina | 50.0 /100 | #174 | Average 65.4% |
| Scotch-Irish | 49.5 /100 | #175 | Average 65.4% |
| French | 48.9 /100 | #176 | Average 65.4% |
| Immigrants | North Macedonia | 48.6 /100 | #177 | Average 65.4% |
| German Russians | 48.3 /100 | #178 | Average 65.4% |
| Guamanians/Chamorros | 48.2 /100 | #179 | Average 65.4% |
| Dutch | 46.1 /100 | #180 | Average 65.3% |
| Spaniards | 45.5 /100 | #181 | Average 65.3% |
| Immigrants | Africa | 44.7 /100 | #182 | Average 65.3% |
| Immigrants | Poland | 42.6 /100 | #183 | Average 65.2% |
Demographics Similar to Immigrants from Northern Europe by College, Under 1 year
In terms of college, under 1 year, the demographic groups most similar to Immigrants from Northern Europe are Soviet Union (71.1%, a difference of 0.010%), Bulgarian (71.1%, a difference of 0.030%), Immigrants from Denmark (71.0%, a difference of 0.14%), Immigrants from Ireland (71.0%, a difference of 0.15%), and Immigrants from Hong Kong (71.0%, a difference of 0.18%).
| Demographics | Rating | Rank | College, Under 1 year |
| Immigrants | Japan | 100.0 /100 | #16 | Exceptional 71.9% |
| Eastern Europeans | 100.0 /100 | #17 | Exceptional 71.8% |
| Immigrants | Switzerland | 100.0 /100 | #18 | Exceptional 71.7% |
| Latvians | 100.0 /100 | #19 | Exceptional 71.6% |
| Immigrants | Korea | 100.0 /100 | #20 | Exceptional 71.6% |
| Immigrants | Belgium | 100.0 /100 | #21 | Exceptional 71.5% |
| Immigrants | Eastern Asia | 100.0 /100 | #22 | Exceptional 71.3% |
| Immigrants | Northern Europe | 100.0 /100 | #23 | Exceptional 71.1% |
| Soviet Union | 100.0 /100 | #24 | Exceptional 71.1% |
| Bulgarians | 100.0 /100 | #25 | Exceptional 71.1% |
| Immigrants | Denmark | 100.0 /100 | #26 | Exceptional 71.0% |
| Immigrants | Ireland | 100.0 /100 | #27 | Exceptional 71.0% |
| Immigrants | Hong Kong | 100.0 /100 | #28 | Exceptional 71.0% |
| Immigrants | France | 100.0 /100 | #29 | Exceptional 71.0% |
| Immigrants | China | 99.9 /100 | #30 | Exceptional 70.9% |