Navajo vs Immigrants from Jamaica GED/Equivalency
COMPARE
Navajo
Immigrants from Jamaica
GED/Equivalency
GED/Equivalency Comparison
Navajo
Immigrants from Jamaica
81.5%
GED/EQUIVALENCY
0.0/ 100
METRIC RATING
304th/ 347
METRIC RANK
82.9%
GED/EQUIVALENCY
0.2/ 100
METRIC RATING
270th/ 347
METRIC RANK
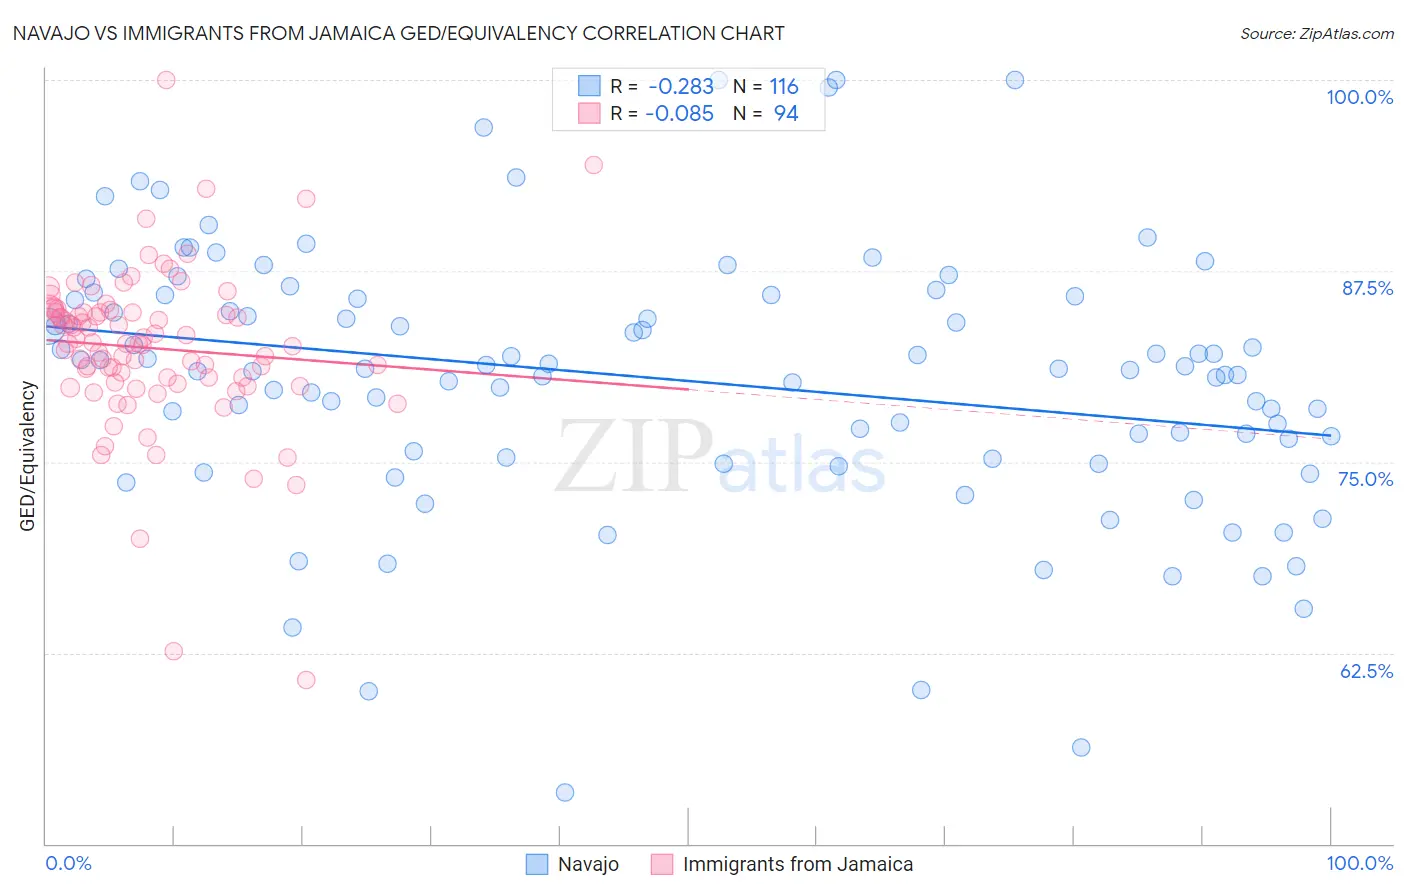
Navajo vs Immigrants from Jamaica GED/Equivalency Correlation Chart
The statistical analysis conducted on geographies consisting of 224,872,856 people shows a weak negative correlation between the proportion of Navajo and percentage of population with at least ged/equivalency education in the United States with a correlation coefficient (R) of -0.283 and weighted average of 81.5%. Similarly, the statistical analysis conducted on geographies consisting of 301,829,399 people shows a slight negative correlation between the proportion of Immigrants from Jamaica and percentage of population with at least ged/equivalency education in the United States with a correlation coefficient (R) of -0.085 and weighted average of 82.9%, a difference of 1.8%.
GED/Equivalency Correlation Summary
| Measurement | Navajo | Immigrants from Jamaica |
| Minimum | 53.3% | 60.8% |
| Maximum | 100.0% | 100.0% |
| Range | 46.7% | 39.2% |
| Mean | 80.4% | 82.4% |
| Median | 81.1% | 82.8% |
| Interquartile 25% (IQ1) | 75.5% | 80.2% |
| Interquartile 75% (IQ3) | 85.8% | 84.8% |
| Interquartile Range (IQR) | 10.3% | 4.6% |
| Standard Deviation (Sample) | 8.6% | 5.4% |
| Standard Deviation (Population) | 8.5% | 5.3% |
Similar Demographics by GED/Equivalency
Demographics Similar to Navajo by GED/Equivalency
In terms of ged/equivalency, the demographic groups most similar to Navajo are Immigrants from Haiti (81.6%, a difference of 0.10%), Immigrants from Portugal (81.6%, a difference of 0.10%), Dutch West Indian (81.6%, a difference of 0.14%), Fijian (81.6%, a difference of 0.20%), and Immigrants from Grenada (81.3%, a difference of 0.21%).
| Demographics | Rating | Rank | GED/Equivalency |
| Immigrants | Bangladesh | 0.0 /100 | #297 | Tragic 81.9% |
| Ute | 0.0 /100 | #298 | Tragic 81.8% |
| Ecuadorians | 0.0 /100 | #299 | Tragic 81.7% |
| Fijians | 0.0 /100 | #300 | Tragic 81.6% |
| Dutch West Indians | 0.0 /100 | #301 | Tragic 81.6% |
| Immigrants | Haiti | 0.0 /100 | #302 | Tragic 81.6% |
| Immigrants | Portugal | 0.0 /100 | #303 | Tragic 81.6% |
| Navajo | 0.0 /100 | #304 | Tragic 81.5% |
| Immigrants | Grenada | 0.0 /100 | #305 | Tragic 81.3% |
| Guyanese | 0.0 /100 | #306 | Tragic 81.3% |
| Immigrants | Dominica | 0.0 /100 | #307 | Tragic 81.1% |
| Puerto Ricans | 0.0 /100 | #308 | Tragic 81.1% |
| Immigrants | Ecuador | 0.0 /100 | #309 | Tragic 81.0% |
| Immigrants | Guyana | 0.0 /100 | #310 | Tragic 81.0% |
| Natives/Alaskans | 0.0 /100 | #311 | Tragic 80.9% |
Demographics Similar to Immigrants from Jamaica by GED/Equivalency
In terms of ged/equivalency, the demographic groups most similar to Immigrants from Jamaica are U.S. Virgin Islander (82.9%, a difference of 0.040%), Hopi (83.0%, a difference of 0.050%), Barbadian (82.9%, a difference of 0.080%), Pennsylvania German (82.9%, a difference of 0.090%), and Immigrants from Burma/Myanmar (83.0%, a difference of 0.10%).
| Demographics | Rating | Rank | GED/Equivalency |
| Immigrants | Congo | 0.2 /100 | #263 | Tragic 83.1% |
| Bangladeshis | 0.2 /100 | #264 | Tragic 83.1% |
| West Indians | 0.2 /100 | #265 | Tragic 83.1% |
| Kiowa | 0.2 /100 | #266 | Tragic 83.1% |
| Trinidadians and Tobagonians | 0.2 /100 | #267 | Tragic 83.0% |
| Immigrants | Burma/Myanmar | 0.2 /100 | #268 | Tragic 83.0% |
| Hopi | 0.2 /100 | #269 | Tragic 83.0% |
| Immigrants | Jamaica | 0.2 /100 | #270 | Tragic 82.9% |
| U.S. Virgin Islanders | 0.2 /100 | #271 | Tragic 82.9% |
| Barbadians | 0.1 /100 | #272 | Tragic 82.9% |
| Pennsylvania Germans | 0.1 /100 | #273 | Tragic 82.9% |
| Immigrants | Trinidad and Tobago | 0.1 /100 | #274 | Tragic 82.8% |
| Seminole | 0.1 /100 | #275 | Tragic 82.8% |
| Blacks/African Americans | 0.1 /100 | #276 | Tragic 82.8% |
| Arapaho | 0.1 /100 | #277 | Tragic 82.8% |