Immigrants from Europe vs Immigrants from Jamaica GED/Equivalency
COMPARE
Immigrants from Europe
Immigrants from Jamaica
GED/Equivalency
GED/Equivalency Comparison
Immigrants from Europe
Immigrants from Jamaica
87.5%
GED/EQUIVALENCY
98.1/ 100
METRIC RATING
86th/ 347
METRIC RANK
82.9%
GED/EQUIVALENCY
0.2/ 100
METRIC RATING
270th/ 347
METRIC RANK
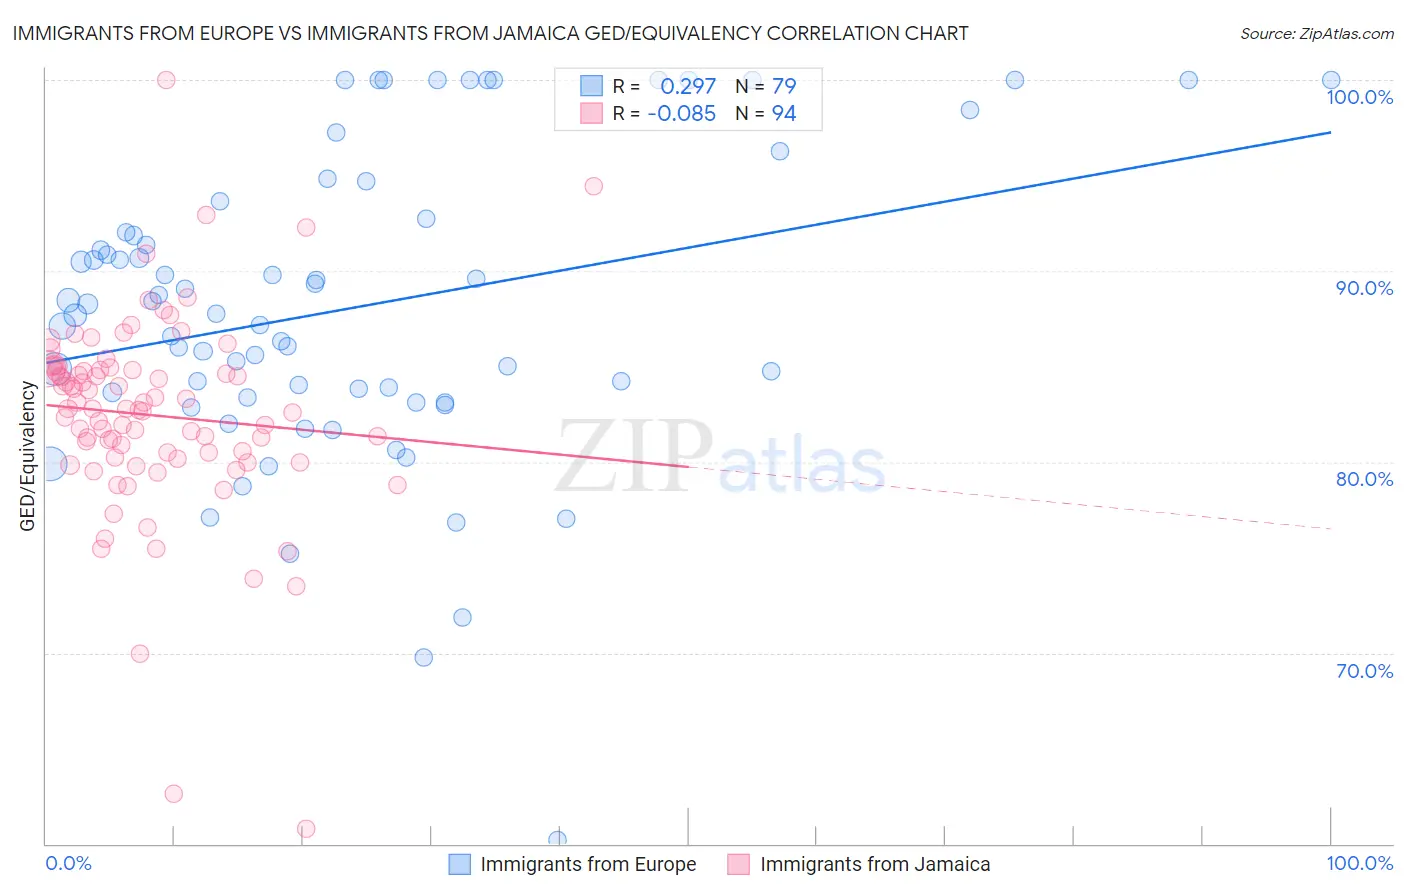
Immigrants from Europe vs Immigrants from Jamaica GED/Equivalency Correlation Chart
The statistical analysis conducted on geographies consisting of 547,425,948 people shows a weak positive correlation between the proportion of Immigrants from Europe and percentage of population with at least ged/equivalency education in the United States with a correlation coefficient (R) of 0.297 and weighted average of 87.5%. Similarly, the statistical analysis conducted on geographies consisting of 301,829,399 people shows a slight negative correlation between the proportion of Immigrants from Jamaica and percentage of population with at least ged/equivalency education in the United States with a correlation coefficient (R) of -0.085 and weighted average of 82.9%, a difference of 5.5%.
GED/Equivalency Correlation Summary
| Measurement | Immigrants from Europe | Immigrants from Jamaica |
| Minimum | 60.2% | 60.8% |
| Maximum | 100.0% | 100.0% |
| Range | 39.8% | 39.2% |
| Mean | 88.1% | 82.4% |
| Median | 87.8% | 82.8% |
| Interquartile 25% (IQ1) | 83.4% | 80.2% |
| Interquartile 75% (IQ3) | 92.7% | 84.8% |
| Interquartile Range (IQR) | 9.3% | 4.6% |
| Standard Deviation (Sample) | 8.0% | 5.4% |
| Standard Deviation (Population) | 8.0% | 5.3% |
Similar Demographics by GED/Equivalency
Demographics Similar to Immigrants from Europe by GED/Equivalency
In terms of ged/equivalency, the demographic groups most similar to Immigrants from Europe are Native Hawaiian (87.5%, a difference of 0.0%), Immigrants from Romania (87.5%, a difference of 0.010%), Dutch (87.5%, a difference of 0.010%), Immigrants from Norway (87.5%, a difference of 0.010%), and South African (87.5%, a difference of 0.050%).
| Demographics | Rating | Rank | GED/Equivalency |
| English | 98.6 /100 | #79 | Exceptional 87.6% |
| Immigrants | England | 98.5 /100 | #80 | Exceptional 87.6% |
| Immigrants | Sri Lanka | 98.3 /100 | #81 | Exceptional 87.5% |
| Romanians | 98.3 /100 | #82 | Exceptional 87.5% |
| South Africans | 98.3 /100 | #83 | Exceptional 87.5% |
| Immigrants | Romania | 98.1 /100 | #84 | Exceptional 87.5% |
| Dutch | 98.1 /100 | #85 | Exceptional 87.5% |
| Immigrants | Europe | 98.1 /100 | #86 | Exceptional 87.5% |
| Native Hawaiians | 98.1 /100 | #87 | Exceptional 87.5% |
| Immigrants | Norway | 98.1 /100 | #88 | Exceptional 87.5% |
| Hungarians | 97.9 /100 | #89 | Exceptional 87.4% |
| Welsh | 97.9 /100 | #90 | Exceptional 87.4% |
| Immigrants | Eastern Asia | 97.9 /100 | #91 | Exceptional 87.4% |
| Israelis | 97.8 /100 | #92 | Exceptional 87.4% |
| Immigrants | North Macedonia | 97.8 /100 | #93 | Exceptional 87.4% |
Demographics Similar to Immigrants from Jamaica by GED/Equivalency
In terms of ged/equivalency, the demographic groups most similar to Immigrants from Jamaica are U.S. Virgin Islander (82.9%, a difference of 0.040%), Hopi (83.0%, a difference of 0.050%), Barbadian (82.9%, a difference of 0.080%), Pennsylvania German (82.9%, a difference of 0.090%), and Immigrants from Burma/Myanmar (83.0%, a difference of 0.10%).
| Demographics | Rating | Rank | GED/Equivalency |
| Immigrants | Congo | 0.2 /100 | #263 | Tragic 83.1% |
| Bangladeshis | 0.2 /100 | #264 | Tragic 83.1% |
| West Indians | 0.2 /100 | #265 | Tragic 83.1% |
| Kiowa | 0.2 /100 | #266 | Tragic 83.1% |
| Trinidadians and Tobagonians | 0.2 /100 | #267 | Tragic 83.0% |
| Immigrants | Burma/Myanmar | 0.2 /100 | #268 | Tragic 83.0% |
| Hopi | 0.2 /100 | #269 | Tragic 83.0% |
| Immigrants | Jamaica | 0.2 /100 | #270 | Tragic 82.9% |
| U.S. Virgin Islanders | 0.2 /100 | #271 | Tragic 82.9% |
| Barbadians | 0.1 /100 | #272 | Tragic 82.9% |
| Pennsylvania Germans | 0.1 /100 | #273 | Tragic 82.9% |
| Immigrants | Trinidad and Tobago | 0.1 /100 | #274 | Tragic 82.8% |
| Seminole | 0.1 /100 | #275 | Tragic 82.8% |
| Blacks/African Americans | 0.1 /100 | #276 | Tragic 82.8% |
| Arapaho | 0.1 /100 | #277 | Tragic 82.8% |