Finnish vs Immigrants from Jamaica In Labor Force | Age 30-34
COMPARE
Finnish
Immigrants from Jamaica
In Labor Force | Age 30-34
In Labor Force | Age 30-34 Comparison
Finns
Immigrants from Jamaica
84.7%
IN LABOR FORCE | AGE 30-34
50.0/ 100
METRIC RATING
174th/ 347
METRIC RANK
84.3%
IN LABOR FORCE | AGE 30-34
7.9/ 100
METRIC RATING
213th/ 347
METRIC RANK
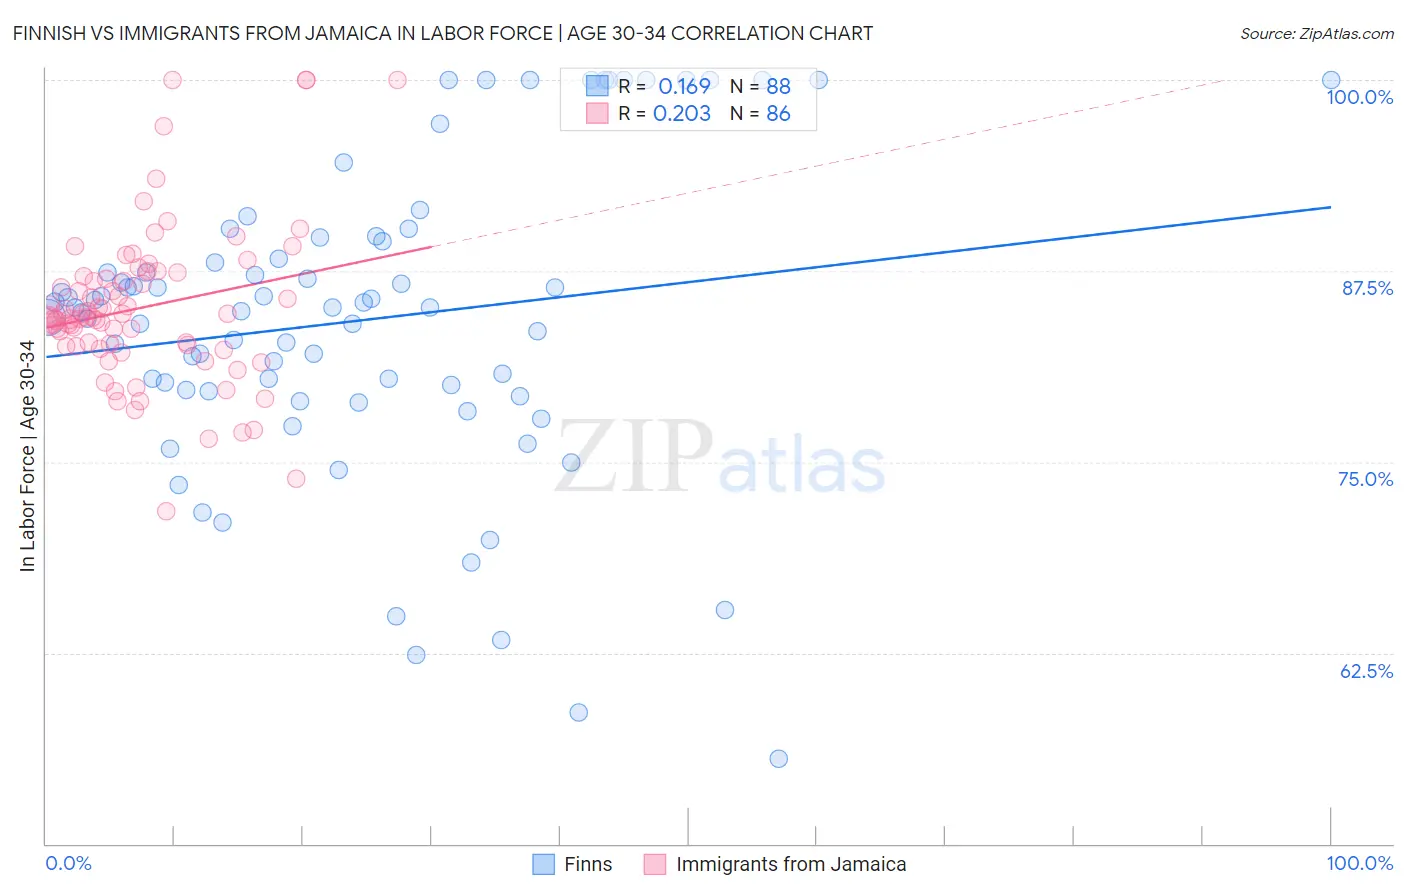
Finnish vs Immigrants from Jamaica In Labor Force | Age 30-34 Correlation Chart
The statistical analysis conducted on geographies consisting of 404,404,222 people shows a poor positive correlation between the proportion of Finns and labor force participation rate among population between the ages 30 and 34 in the United States with a correlation coefficient (R) of 0.169 and weighted average of 84.7%. Similarly, the statistical analysis conducted on geographies consisting of 301,677,479 people shows a weak positive correlation between the proportion of Immigrants from Jamaica and labor force participation rate among population between the ages 30 and 34 in the United States with a correlation coefficient (R) of 0.203 and weighted average of 84.3%, a difference of 0.43%.
In Labor Force | Age 30-34 Correlation Summary
| Measurement | Finnish | Immigrants from Jamaica |
| Minimum | 55.6% | 71.8% |
| Maximum | 100.0% | 100.0% |
| Range | 44.4% | 28.2% |
| Mean | 84.2% | 85.1% |
| Median | 85.1% | 84.5% |
| Interquartile 25% (IQ1) | 79.7% | 82.6% |
| Interquartile 75% (IQ3) | 88.9% | 87.2% |
| Interquartile Range (IQR) | 9.2% | 4.6% |
| Standard Deviation (Sample) | 9.9% | 5.2% |
| Standard Deviation (Population) | 9.9% | 5.1% |
Similar Demographics by In Labor Force | Age 30-34
Demographics Similar to Finns by In Labor Force | Age 30-34
In terms of in labor force | age 30-34, the demographic groups most similar to Finns are Immigrants from South America (84.7%, a difference of 0.0%), Immigrants from Burma/Myanmar (84.7%, a difference of 0.010%), Irish (84.7%, a difference of 0.010%), Immigrants from England (84.7%, a difference of 0.010%), and Israeli (84.7%, a difference of 0.010%).
| Demographics | Rating | Rank | In Labor Force | Age 30-34 |
| Immigrants | South Eastern Asia | 54.2 /100 | #167 | Average 84.7% |
| Immigrants | Peru | 52.4 /100 | #168 | Average 84.7% |
| South American Indians | 52.1 /100 | #169 | Average 84.7% |
| Immigrants | Burma/Myanmar | 52.0 /100 | #170 | Average 84.7% |
| Irish | 52.0 /100 | #171 | Average 84.7% |
| Immigrants | England | 51.7 /100 | #172 | Average 84.7% |
| Israelis | 51.1 /100 | #173 | Average 84.7% |
| Finns | 50.0 /100 | #174 | Average 84.7% |
| Immigrants | South America | 50.0 /100 | #175 | Average 84.7% |
| Immigrants | Uzbekistan | 49.1 /100 | #176 | Average 84.7% |
| Laotians | 46.9 /100 | #177 | Average 84.7% |
| Okinawans | 44.1 /100 | #178 | Average 84.6% |
| Immigrants | Nigeria | 42.5 /100 | #179 | Average 84.6% |
| Immigrants | Netherlands | 42.1 /100 | #180 | Average 84.6% |
| Moroccans | 40.3 /100 | #181 | Average 84.6% |
Demographics Similar to Immigrants from Jamaica by In Labor Force | Age 30-34
In terms of in labor force | age 30-34, the demographic groups most similar to Immigrants from Jamaica are Immigrants from Western Asia (84.3%, a difference of 0.010%), Arab (84.3%, a difference of 0.020%), Jamaican (84.3%, a difference of 0.020%), Indonesian (84.3%, a difference of 0.020%), and Japanese (84.3%, a difference of 0.020%).
| Demographics | Rating | Rank | In Labor Force | Age 30-34 |
| Lebanese | 10.6 /100 | #206 | Poor 84.4% |
| Bangladeshis | 9.4 /100 | #207 | Tragic 84.3% |
| Arabs | 8.9 /100 | #208 | Tragic 84.3% |
| Jamaicans | 8.8 /100 | #209 | Tragic 84.3% |
| Indonesians | 8.8 /100 | #210 | Tragic 84.3% |
| Japanese | 8.8 /100 | #211 | Tragic 84.3% |
| Immigrants | Western Asia | 8.2 /100 | #212 | Tragic 84.3% |
| Immigrants | Jamaica | 7.9 /100 | #213 | Tragic 84.3% |
| Immigrants | Germany | 7.2 /100 | #214 | Tragic 84.3% |
| Europeans | 7.2 /100 | #215 | Tragic 84.3% |
| Immigrants | Ecuador | 7.1 /100 | #216 | Tragic 84.3% |
| Immigrants | Trinidad and Tobago | 7.0 /100 | #217 | Tragic 84.3% |
| Immigrants | Panama | 6.3 /100 | #218 | Tragic 84.3% |
| Swiss | 5.8 /100 | #219 | Tragic 84.3% |
| Danes | 5.3 /100 | #220 | Tragic 84.3% |