Ethiopian vs Subsaharan African Nursery School
COMPARE
Ethiopian
Subsaharan African
Nursery School
Nursery School Comparison
Ethiopians
Sub-Saharan Africans
97.6%
NURSERY SCHOOL
0.8/ 100
METRIC RATING
251st/ 347
METRIC RANK
97.7%
NURSERY SCHOOL
3.2/ 100
METRIC RATING
227th/ 347
METRIC RANK
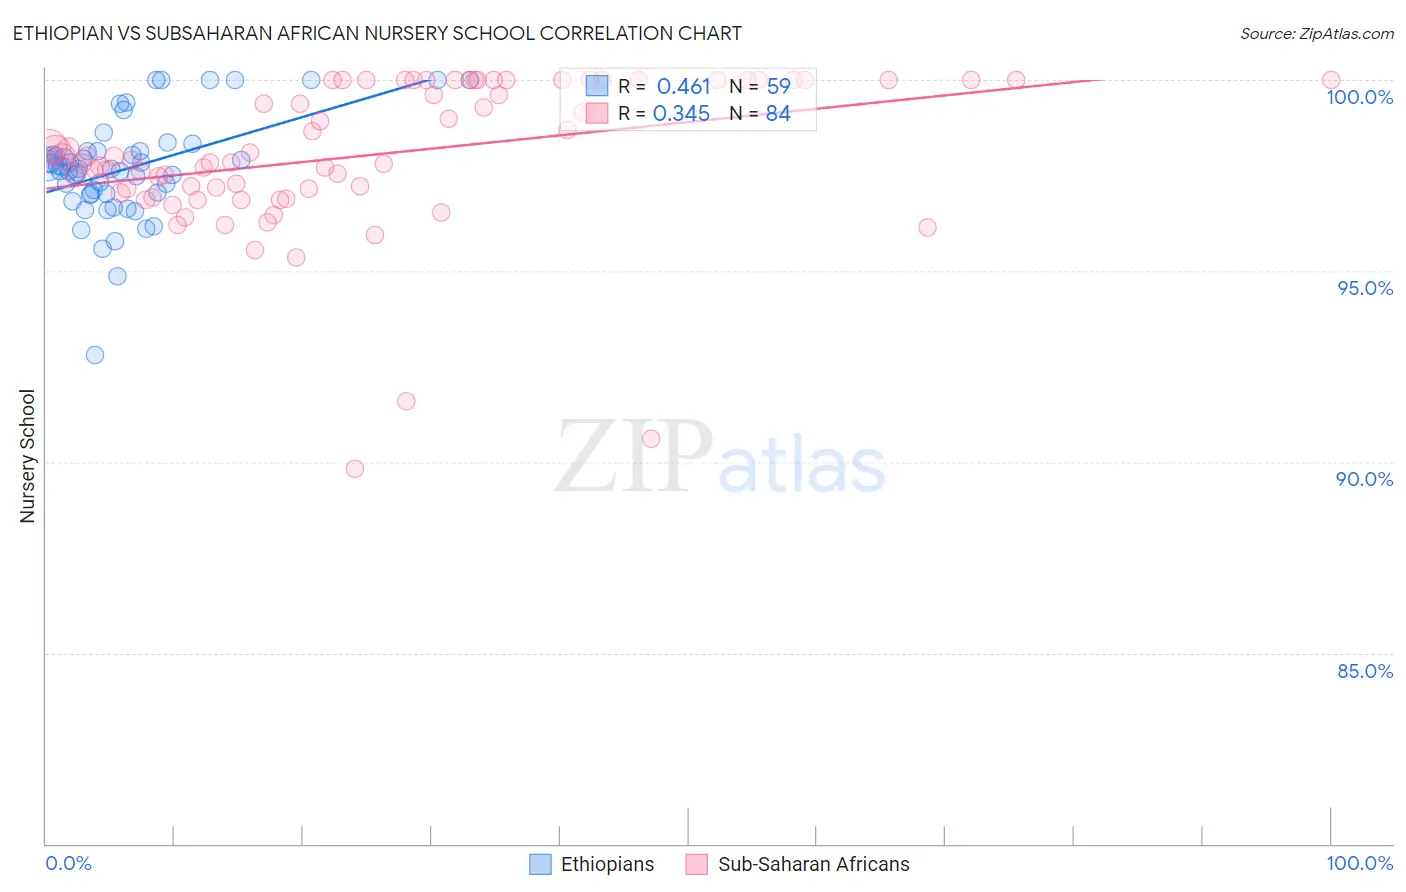
Ethiopian vs Subsaharan African Nursery School Correlation Chart
The statistical analysis conducted on geographies consisting of 223,220,814 people shows a moderate positive correlation between the proportion of Ethiopians and percentage of population with at least nursery school education in the United States with a correlation coefficient (R) of 0.461 and weighted average of 97.6%. Similarly, the statistical analysis conducted on geographies consisting of 508,209,936 people shows a mild positive correlation between the proportion of Sub-Saharan Africans and percentage of population with at least nursery school education in the United States with a correlation coefficient (R) of 0.345 and weighted average of 97.7%, a difference of 0.11%.
Nursery School Correlation Summary
| Measurement | Ethiopian | Subsaharan African |
| Minimum | 92.8% | 89.8% |
| Maximum | 100.0% | 100.0% |
| Range | 7.2% | 10.2% |
| Mean | 97.7% | 98.0% |
| Median | 97.7% | 97.9% |
| Interquartile 25% (IQ1) | 97.0% | 97.1% |
| Interquartile 75% (IQ3) | 98.1% | 100.0% |
| Interquartile Range (IQR) | 1.1% | 2.9% |
| Standard Deviation (Sample) | 1.3% | 2.0% |
| Standard Deviation (Population) | 1.3% | 2.0% |
Similar Demographics by Nursery School
Demographics Similar to Ethiopians by Nursery School
In terms of nursery school, the demographic groups most similar to Ethiopians are Immigrants from Africa (97.6%, a difference of 0.0%), Peruvian (97.6%, a difference of 0.010%), Immigrants from Middle Africa (97.6%, a difference of 0.010%), Indian (Asian) (97.6%, a difference of 0.010%), and Immigrants from Eastern Africa (97.6%, a difference of 0.010%).
| Demographics | Rating | Rank | Nursery School |
| South Americans | 1.0 /100 | #244 | Tragic 97.6% |
| Bolivians | 1.0 /100 | #245 | Tragic 97.6% |
| Peruvians | 1.0 /100 | #246 | Tragic 97.6% |
| Immigrants | Middle Africa | 0.9 /100 | #247 | Tragic 97.6% |
| Indians (Asian) | 0.9 /100 | #248 | Tragic 97.6% |
| Immigrants | Eastern Africa | 0.9 /100 | #249 | Tragic 97.6% |
| Immigrants | Senegal | 0.9 /100 | #250 | Tragic 97.6% |
| Ethiopians | 0.8 /100 | #251 | Tragic 97.6% |
| Immigrants | Africa | 0.8 /100 | #252 | Tragic 97.6% |
| Immigrants | Iraq | 0.7 /100 | #253 | Tragic 97.6% |
| Immigrants | Congo | 0.7 /100 | #254 | Tragic 97.6% |
| Immigrants | Asia | 0.7 /100 | #255 | Tragic 97.6% |
| Yaqui | 0.6 /100 | #256 | Tragic 97.6% |
| Immigrants | Colombia | 0.6 /100 | #257 | Tragic 97.6% |
| Jamaicans | 0.6 /100 | #258 | Tragic 97.6% |
Demographics Similar to Sub-Saharan Africans by Nursery School
In terms of nursery school, the demographic groups most similar to Sub-Saharan Africans are Sudanese (97.7%, a difference of 0.0%), Senegalese (97.7%, a difference of 0.0%), Immigrants from Nepal (97.7%, a difference of 0.010%), Immigrants from Costa Rica (97.7%, a difference of 0.010%), and Iraqi (97.7%, a difference of 0.010%).
| Demographics | Rating | Rank | Nursery School |
| Immigrants | Zaire | 4.4 /100 | #220 | Tragic 97.8% |
| Tongans | 4.3 /100 | #221 | Tragic 97.8% |
| Immigrants | Syria | 4.0 /100 | #222 | Tragic 97.7% |
| Immigrants | Sudan | 3.9 /100 | #223 | Tragic 97.7% |
| Immigrants | Nepal | 3.6 /100 | #224 | Tragic 97.7% |
| Immigrants | Costa Rica | 3.5 /100 | #225 | Tragic 97.7% |
| Iraqis | 3.5 /100 | #226 | Tragic 97.7% |
| Sub-Saharan Africans | 3.2 /100 | #227 | Tragic 97.7% |
| Sudanese | 3.2 /100 | #228 | Tragic 97.7% |
| Senegalese | 3.2 /100 | #229 | Tragic 97.7% |
| Sierra Leoneans | 2.9 /100 | #230 | Tragic 97.7% |
| Puerto Ricans | 2.6 /100 | #231 | Tragic 97.7% |
| Immigrants | Uruguay | 2.3 /100 | #232 | Tragic 97.7% |
| U.S. Virgin Islanders | 2.1 /100 | #233 | Tragic 97.7% |
| Colombians | 2.1 /100 | #234 | Tragic 97.7% |