Liberian vs Subsaharan African Nursery School
COMPARE
Liberian
Subsaharan African
Nursery School
Nursery School Comparison
Liberians
Sub-Saharan Africans
97.7%
NURSERY SCHOOL
1.1/ 100
METRIC RATING
242nd/ 347
METRIC RANK
97.7%
NURSERY SCHOOL
3.2/ 100
METRIC RATING
227th/ 347
METRIC RANK
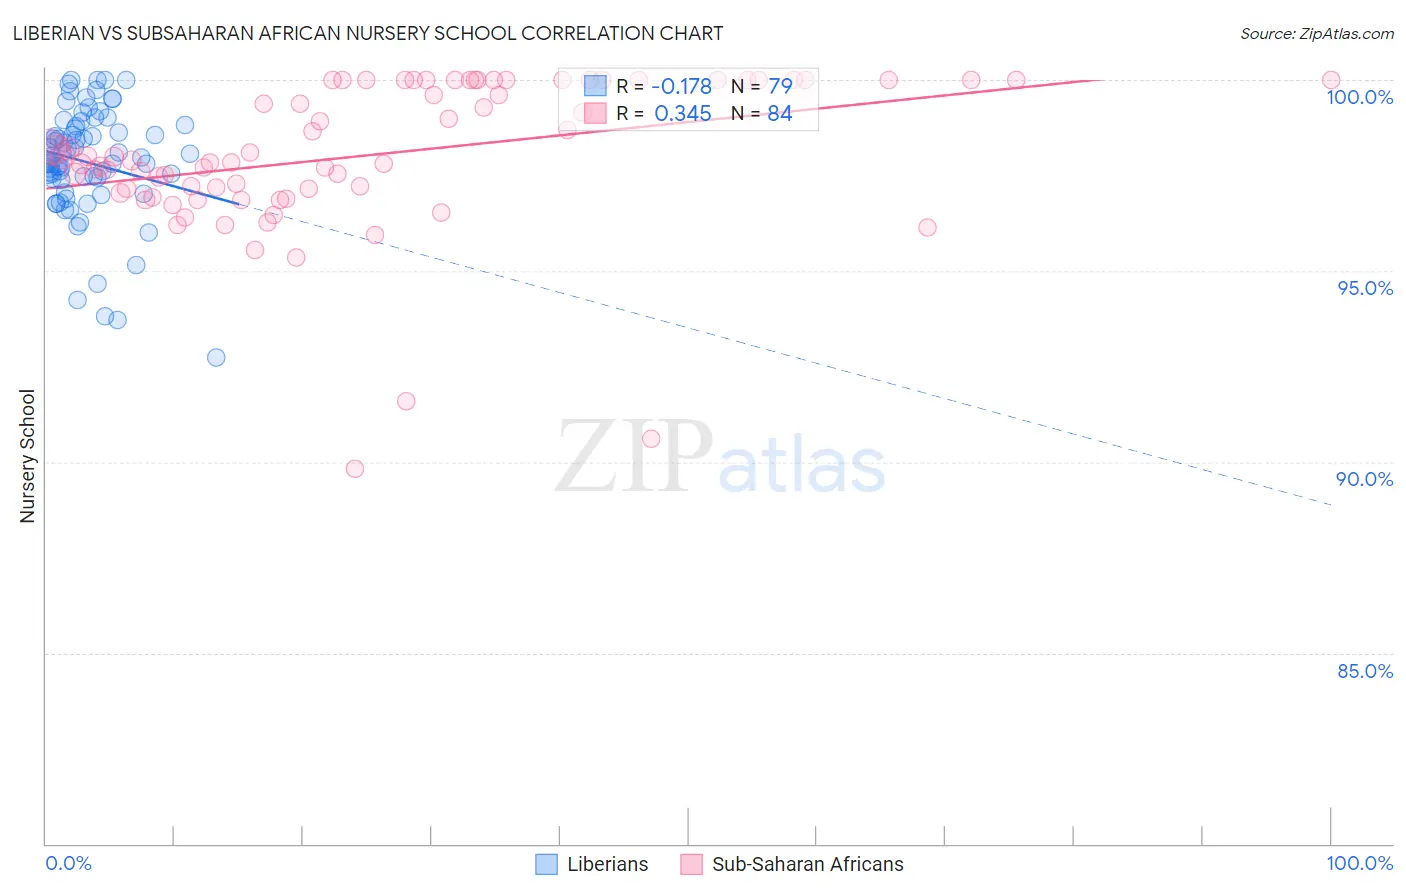
Liberian vs Subsaharan African Nursery School Correlation Chart
The statistical analysis conducted on geographies consisting of 118,100,194 people shows a poor negative correlation between the proportion of Liberians and percentage of population with at least nursery school education in the United States with a correlation coefficient (R) of -0.178 and weighted average of 97.7%. Similarly, the statistical analysis conducted on geographies consisting of 508,209,936 people shows a mild positive correlation between the proportion of Sub-Saharan Africans and percentage of population with at least nursery school education in the United States with a correlation coefficient (R) of 0.345 and weighted average of 97.7%, a difference of 0.080%.
Nursery School Correlation Summary
| Measurement | Liberian | Subsaharan African |
| Minimum | 92.7% | 89.8% |
| Maximum | 100.0% | 100.0% |
| Range | 7.3% | 10.2% |
| Mean | 97.8% | 98.0% |
| Median | 98.0% | 97.9% |
| Interquartile 25% (IQ1) | 97.4% | 97.1% |
| Interquartile 75% (IQ3) | 98.8% | 100.0% |
| Interquartile Range (IQR) | 1.4% | 2.9% |
| Standard Deviation (Sample) | 1.5% | 2.0% |
| Standard Deviation (Population) | 1.5% | 2.0% |
Demographics Similar to Liberians and Sub-Saharan Africans by Nursery School
In terms of nursery school, the demographic groups most similar to Liberians are Immigrants from Indonesia (97.7%, a difference of 0.0%), Asian (97.6%, a difference of 0.0%), South American (97.6%, a difference of 0.010%), Korean (97.7%, a difference of 0.020%), and Nigerian (97.7%, a difference of 0.030%). Similarly, the demographic groups most similar to Sub-Saharan Africans are Sudanese (97.7%, a difference of 0.0%), Senegalese (97.7%, a difference of 0.0%), Immigrants from Nepal (97.7%, a difference of 0.010%), Immigrants from Costa Rica (97.7%, a difference of 0.010%), and Iraqi (97.7%, a difference of 0.010%).
| Demographics | Rating | Rank | Nursery School |
| Immigrants | Nepal | 3.6 /100 | #224 | Tragic 97.7% |
| Immigrants | Costa Rica | 3.5 /100 | #225 | Tragic 97.7% |
| Iraqis | 3.5 /100 | #226 | Tragic 97.7% |
| Sub-Saharan Africans | 3.2 /100 | #227 | Tragic 97.7% |
| Sudanese | 3.2 /100 | #228 | Tragic 97.7% |
| Senegalese | 3.2 /100 | #229 | Tragic 97.7% |
| Sierra Leoneans | 2.9 /100 | #230 | Tragic 97.7% |
| Puerto Ricans | 2.6 /100 | #231 | Tragic 97.7% |
| Immigrants | Uruguay | 2.3 /100 | #232 | Tragic 97.7% |
| U.S. Virgin Islanders | 2.1 /100 | #233 | Tragic 97.7% |
| Colombians | 2.1 /100 | #234 | Tragic 97.7% |
| Immigrants | Pakistan | 2.1 /100 | #235 | Tragic 97.7% |
| Immigrants | Malaysia | 1.9 /100 | #236 | Tragic 97.7% |
| Immigrants | Western Asia | 1.9 /100 | #237 | Tragic 97.7% |
| Nigerians | 1.7 /100 | #238 | Tragic 97.7% |
| Immigrants | Eastern Asia | 1.6 /100 | #239 | Tragic 97.7% |
| Koreans | 1.4 /100 | #240 | Tragic 97.7% |
| Immigrants | Indonesia | 1.1 /100 | #241 | Tragic 97.7% |
| Liberians | 1.1 /100 | #242 | Tragic 97.7% |
| Asians | 1.1 /100 | #243 | Tragic 97.6% |
| South Americans | 1.0 /100 | #244 | Tragic 97.6% |