Ethiopian vs Subsaharan African Householder Income Under 25 years
COMPARE
Ethiopian
Subsaharan African
Householder Income Under 25 years
Householder Income Under 25 years Comparison
Ethiopians
Sub-Saharan Africans
$53,818
HOUSEHOLDER INCOME UNDER 25 YEARS
98.2/ 100
METRIC RATING
104th/ 347
METRIC RANK
$48,691
HOUSEHOLDER INCOME UNDER 25 YEARS
0.0/ 100
METRIC RATING
293rd/ 347
METRIC RANK
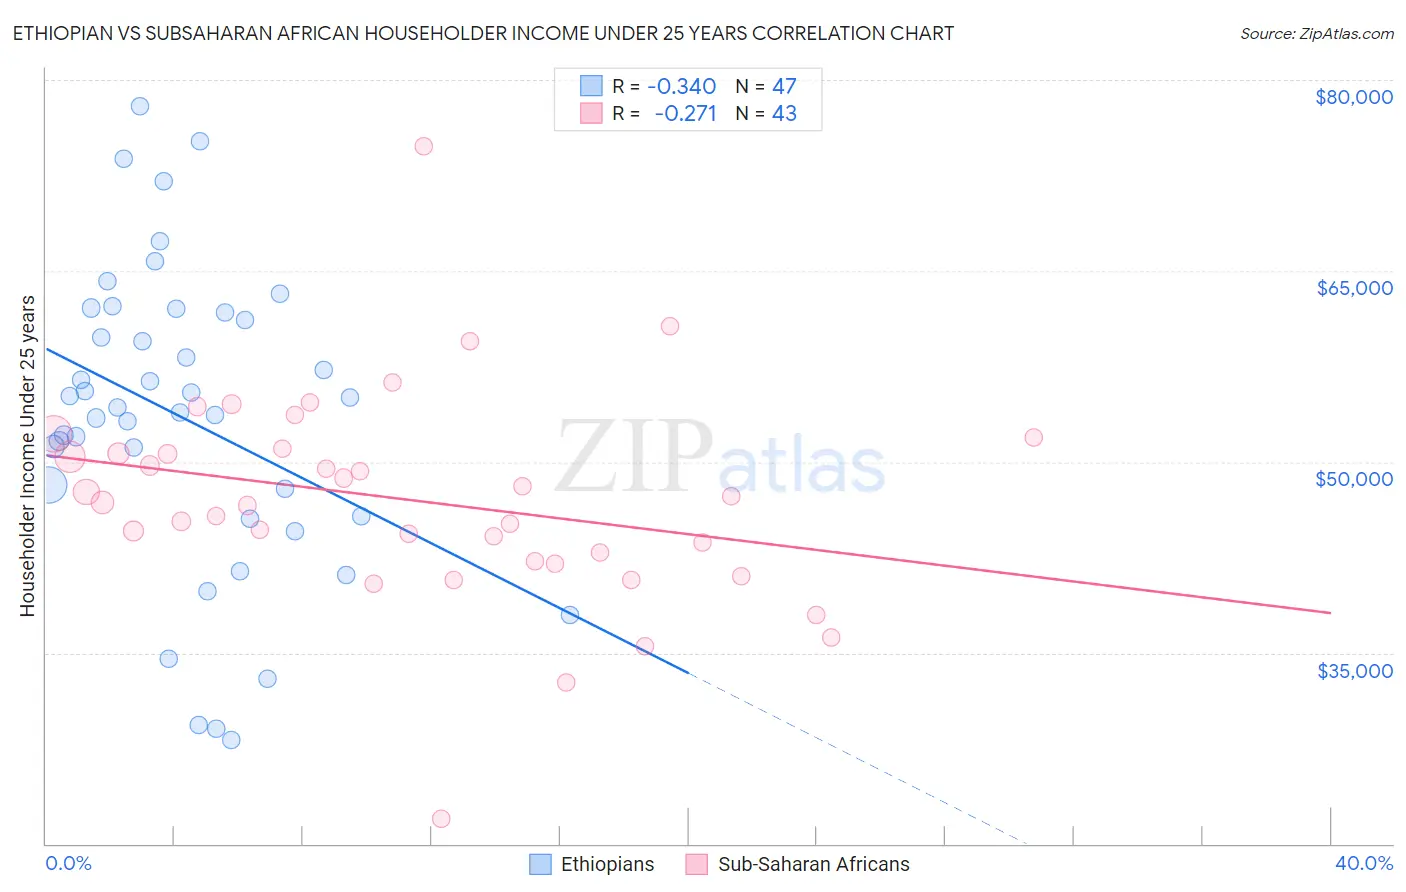
Ethiopian vs Subsaharan African Householder Income Under 25 years Correlation Chart
The statistical analysis conducted on geographies consisting of 201,530,773 people shows a mild negative correlation between the proportion of Ethiopians and household income with householder under the age of 25 in the United States with a correlation coefficient (R) of -0.340 and weighted average of $53,818. Similarly, the statistical analysis conducted on geographies consisting of 413,616,575 people shows a weak negative correlation between the proportion of Sub-Saharan Africans and household income with householder under the age of 25 in the United States with a correlation coefficient (R) of -0.271 and weighted average of $48,691, a difference of 10.5%.
Householder Income Under 25 years Correlation Summary
| Measurement | Ethiopian | Subsaharan African |
| Minimum | $28,125 | $21,932 |
| Maximum | $77,898 | $74,779 |
| Range | $49,773 | $52,847 |
| Mean | $53,404 | $46,996 |
| Median | $54,292 | $46,794 |
| Interquartile 25% (IQ1) | $45,695 | $42,165 |
| Interquartile 75% (IQ3) | $61,784 | $51,035 |
| Interquartile Range (IQR) | $16,089 | $8,871 |
| Standard Deviation (Sample) | $11,871 | $8,415 |
| Standard Deviation (Population) | $11,744 | $8,316 |
Similar Demographics by Householder Income Under 25 years
Demographics Similar to Ethiopians by Householder Income Under 25 years
In terms of householder income under 25 years, the demographic groups most similar to Ethiopians are Immigrants from France ($53,805, a difference of 0.020%), Ukrainian ($53,843, a difference of 0.050%), Albanian ($53,794, a difference of 0.050%), Australian ($53,739, a difference of 0.15%), and Maltese ($53,735, a difference of 0.15%).
| Demographics | Rating | Rank | Householder Income Under 25 years |
| Immigrants | Portugal | 99.1 /100 | #97 | Exceptional $54,105 |
| Eastern Europeans | 99.0 /100 | #98 | Exceptional $54,066 |
| Alaska Natives | 98.8 /100 | #99 | Exceptional $54,000 |
| Immigrants | Kazakhstan | 98.8 /100 | #100 | Exceptional $53,990 |
| South Americans | 98.6 /100 | #101 | Exceptional $53,939 |
| Ecuadorians | 98.5 /100 | #102 | Exceptional $53,911 |
| Ukrainians | 98.3 /100 | #103 | Exceptional $53,843 |
| Ethiopians | 98.2 /100 | #104 | Exceptional $53,818 |
| Immigrants | France | 98.1 /100 | #105 | Exceptional $53,805 |
| Albanians | 98.1 /100 | #106 | Exceptional $53,794 |
| Australians | 97.8 /100 | #107 | Exceptional $53,739 |
| Maltese | 97.8 /100 | #108 | Exceptional $53,735 |
| Immigrants | Ecuador | 97.7 /100 | #109 | Exceptional $53,722 |
| Greeks | 97.7 /100 | #110 | Exceptional $53,715 |
| Immigrants | Colombia | 97.7 /100 | #111 | Exceptional $53,714 |
Demographics Similar to Sub-Saharan Africans by Householder Income Under 25 years
In terms of householder income under 25 years, the demographic groups most similar to Sub-Saharan Africans are Shoshone ($48,720, a difference of 0.060%), Somali ($48,657, a difference of 0.070%), Central American Indian ($48,643, a difference of 0.10%), Immigrants from Burma/Myanmar ($48,749, a difference of 0.12%), and Blackfeet ($48,603, a difference of 0.18%).
| Demographics | Rating | Rank | Householder Income Under 25 years |
| French American Indians | 0.0 /100 | #286 | Tragic $48,977 |
| Senegalese | 0.0 /100 | #287 | Tragic $48,953 |
| Liberians | 0.0 /100 | #288 | Tragic $48,917 |
| Hondurans | 0.0 /100 | #289 | Tragic $48,885 |
| Americans | 0.0 /100 | #290 | Tragic $48,860 |
| Immigrants | Burma/Myanmar | 0.0 /100 | #291 | Tragic $48,749 |
| Shoshone | 0.0 /100 | #292 | Tragic $48,720 |
| Sub-Saharan Africans | 0.0 /100 | #293 | Tragic $48,691 |
| Somalis | 0.0 /100 | #294 | Tragic $48,657 |
| Central American Indians | 0.0 /100 | #295 | Tragic $48,643 |
| Blackfeet | 0.0 /100 | #296 | Tragic $48,603 |
| Cree | 0.0 /100 | #297 | Tragic $48,514 |
| Yaqui | 0.0 /100 | #298 | Tragic $48,300 |
| Immigrants | Honduras | 0.0 /100 | #299 | Tragic $48,267 |
| Immigrants | Somalia | 0.0 /100 | #300 | Tragic $48,135 |