Immigrants from Austria vs Subsaharan African Nursery School
COMPARE
Immigrants from Austria
Subsaharan African
Nursery School
Nursery School Comparison
Immigrants from Austria
Sub-Saharan Africans
98.4%
NURSERY SCHOOL
99.6/ 100
METRIC RATING
69th/ 347
METRIC RANK
97.7%
NURSERY SCHOOL
3.2/ 100
METRIC RATING
227th/ 347
METRIC RANK
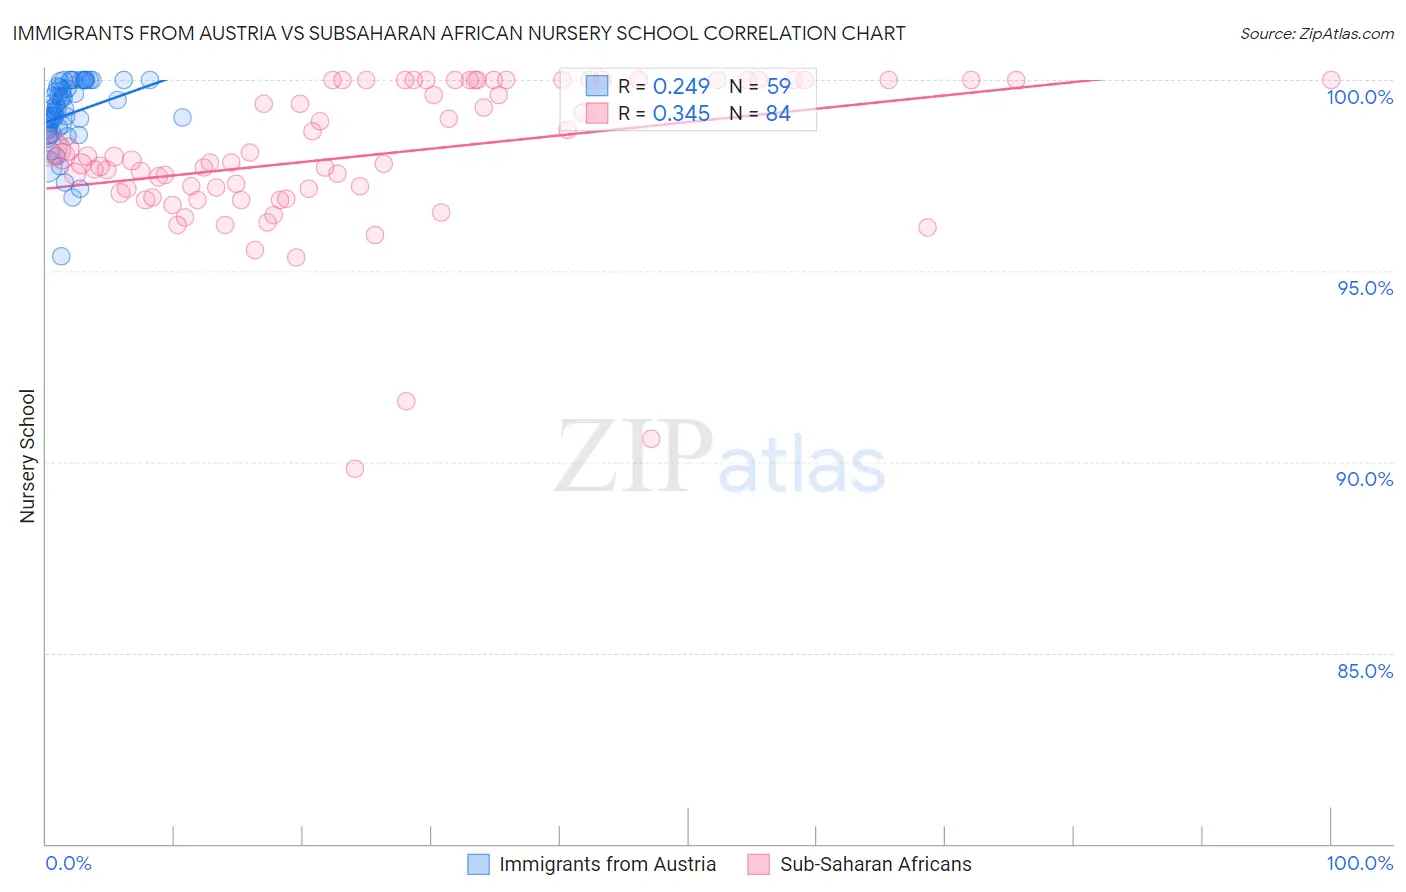
Immigrants from Austria vs Subsaharan African Nursery School Correlation Chart
The statistical analysis conducted on geographies consisting of 167,973,800 people shows a weak positive correlation between the proportion of Immigrants from Austria and percentage of population with at least nursery school education in the United States with a correlation coefficient (R) of 0.249 and weighted average of 98.4%. Similarly, the statistical analysis conducted on geographies consisting of 508,209,936 people shows a mild positive correlation between the proportion of Sub-Saharan Africans and percentage of population with at least nursery school education in the United States with a correlation coefficient (R) of 0.345 and weighted average of 97.7%, a difference of 0.68%.
Nursery School Correlation Summary
| Measurement | Immigrants from Austria | Subsaharan African |
| Minimum | 95.4% | 89.8% |
| Maximum | 100.0% | 100.0% |
| Range | 4.6% | 10.2% |
| Mean | 99.1% | 98.0% |
| Median | 99.2% | 97.9% |
| Interquartile 25% (IQ1) | 98.7% | 97.1% |
| Interquartile 75% (IQ3) | 99.8% | 100.0% |
| Interquartile Range (IQR) | 1.1% | 2.9% |
| Standard Deviation (Sample) | 0.92% | 2.0% |
| Standard Deviation (Population) | 0.91% | 2.0% |
Similar Demographics by Nursery School
Demographics Similar to Immigrants from Austria by Nursery School
In terms of nursery school, the demographic groups most similar to Immigrants from Austria are Immigrants from Northern Europe (98.4%, a difference of 0.0%), Russian (98.4%, a difference of 0.0%), Cheyenne (98.4%, a difference of 0.0%), Serbian (98.4%, a difference of 0.0%), and Canadian (98.4%, a difference of 0.010%).
| Demographics | Rating | Rank | Nursery School |
| Creek | 99.7 /100 | #62 | Exceptional 98.4% |
| Immigrants | North America | 99.7 /100 | #63 | Exceptional 98.4% |
| Greeks | 99.7 /100 | #64 | Exceptional 98.4% |
| Maltese | 99.7 /100 | #65 | Exceptional 98.4% |
| Canadians | 99.7 /100 | #66 | Exceptional 98.4% |
| Immigrants | Northern Europe | 99.6 /100 | #67 | Exceptional 98.4% |
| Russians | 99.6 /100 | #68 | Exceptional 98.4% |
| Immigrants | Austria | 99.6 /100 | #69 | Exceptional 98.4% |
| Cheyenne | 99.6 /100 | #70 | Exceptional 98.4% |
| Serbians | 99.6 /100 | #71 | Exceptional 98.4% |
| Chickasaw | 99.6 /100 | #72 | Exceptional 98.4% |
| Cajuns | 99.4 /100 | #73 | Exceptional 98.4% |
| Immigrants | Netherlands | 99.4 /100 | #74 | Exceptional 98.4% |
| Cherokee | 99.3 /100 | #75 | Exceptional 98.3% |
| Immigrants | England | 99.3 /100 | #76 | Exceptional 98.3% |
Demographics Similar to Sub-Saharan Africans by Nursery School
In terms of nursery school, the demographic groups most similar to Sub-Saharan Africans are Sudanese (97.7%, a difference of 0.0%), Senegalese (97.7%, a difference of 0.0%), Immigrants from Nepal (97.7%, a difference of 0.010%), Immigrants from Costa Rica (97.7%, a difference of 0.010%), and Iraqi (97.7%, a difference of 0.010%).
| Demographics | Rating | Rank | Nursery School |
| Immigrants | Zaire | 4.4 /100 | #220 | Tragic 97.8% |
| Tongans | 4.3 /100 | #221 | Tragic 97.8% |
| Immigrants | Syria | 4.0 /100 | #222 | Tragic 97.7% |
| Immigrants | Sudan | 3.9 /100 | #223 | Tragic 97.7% |
| Immigrants | Nepal | 3.6 /100 | #224 | Tragic 97.7% |
| Immigrants | Costa Rica | 3.5 /100 | #225 | Tragic 97.7% |
| Iraqis | 3.5 /100 | #226 | Tragic 97.7% |
| Sub-Saharan Africans | 3.2 /100 | #227 | Tragic 97.7% |
| Sudanese | 3.2 /100 | #228 | Tragic 97.7% |
| Senegalese | 3.2 /100 | #229 | Tragic 97.7% |
| Sierra Leoneans | 2.9 /100 | #230 | Tragic 97.7% |
| Puerto Ricans | 2.6 /100 | #231 | Tragic 97.7% |
| Immigrants | Uruguay | 2.3 /100 | #232 | Tragic 97.7% |
| U.S. Virgin Islanders | 2.1 /100 | #233 | Tragic 97.7% |
| Colombians | 2.1 /100 | #234 | Tragic 97.7% |