Ethiopian vs Immigrants from Europe Nursery School
COMPARE
Ethiopian
Immigrants from Europe
Nursery School
Nursery School Comparison
Ethiopians
Immigrants from Europe
97.6%
NURSERY SCHOOL
0.8/ 100
METRIC RATING
251st/ 347
METRIC RANK
98.1%
NURSERY SCHOOL
90.7/ 100
METRIC RATING
133rd/ 347
METRIC RANK
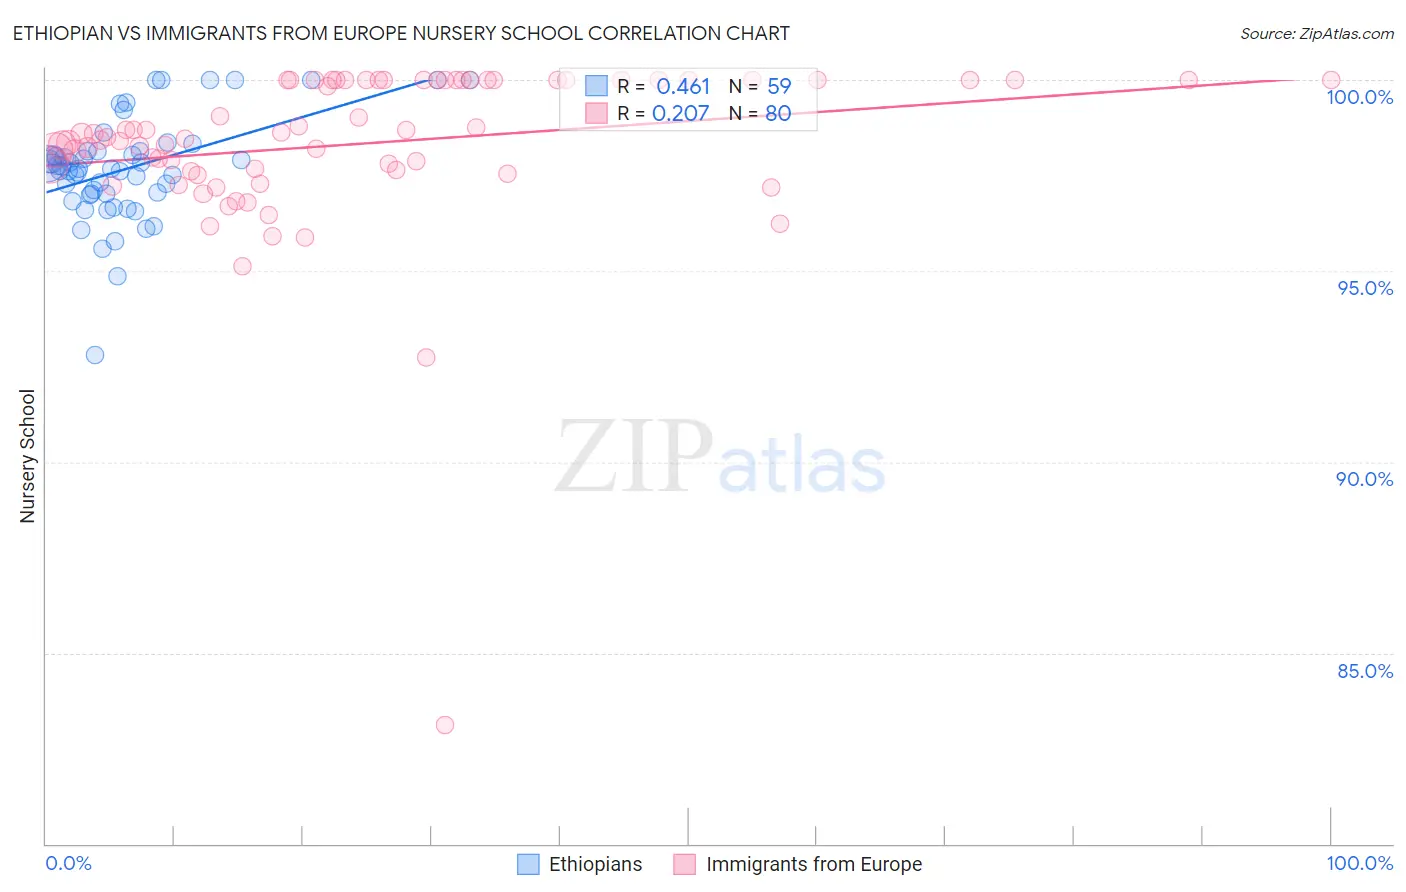
Ethiopian vs Immigrants from Europe Nursery School Correlation Chart
The statistical analysis conducted on geographies consisting of 223,220,814 people shows a moderate positive correlation between the proportion of Ethiopians and percentage of population with at least nursery school education in the United States with a correlation coefficient (R) of 0.461 and weighted average of 97.6%. Similarly, the statistical analysis conducted on geographies consisting of 547,425,973 people shows a weak positive correlation between the proportion of Immigrants from Europe and percentage of population with at least nursery school education in the United States with a correlation coefficient (R) of 0.207 and weighted average of 98.1%, a difference of 0.54%.
Nursery School Correlation Summary
| Measurement | Ethiopian | Immigrants from Europe |
| Minimum | 92.8% | 83.1% |
| Maximum | 100.0% | 100.0% |
| Range | 7.2% | 16.9% |
| Mean | 97.7% | 98.3% |
| Median | 97.7% | 98.5% |
| Interquartile 25% (IQ1) | 97.0% | 97.6% |
| Interquartile 75% (IQ3) | 98.1% | 100.0% |
| Interquartile Range (IQR) | 1.1% | 2.4% |
| Standard Deviation (Sample) | 1.3% | 2.2% |
| Standard Deviation (Population) | 1.3% | 2.2% |
Similar Demographics by Nursery School
Demographics Similar to Ethiopians by Nursery School
In terms of nursery school, the demographic groups most similar to Ethiopians are Immigrants from Africa (97.6%, a difference of 0.0%), Peruvian (97.6%, a difference of 0.010%), Immigrants from Middle Africa (97.6%, a difference of 0.010%), Indian (Asian) (97.6%, a difference of 0.010%), and Immigrants from Eastern Africa (97.6%, a difference of 0.010%).
| Demographics | Rating | Rank | Nursery School |
| South Americans | 1.0 /100 | #244 | Tragic 97.6% |
| Bolivians | 1.0 /100 | #245 | Tragic 97.6% |
| Peruvians | 1.0 /100 | #246 | Tragic 97.6% |
| Immigrants | Middle Africa | 0.9 /100 | #247 | Tragic 97.6% |
| Indians (Asian) | 0.9 /100 | #248 | Tragic 97.6% |
| Immigrants | Eastern Africa | 0.9 /100 | #249 | Tragic 97.6% |
| Immigrants | Senegal | 0.9 /100 | #250 | Tragic 97.6% |
| Ethiopians | 0.8 /100 | #251 | Tragic 97.6% |
| Immigrants | Africa | 0.8 /100 | #252 | Tragic 97.6% |
| Immigrants | Iraq | 0.7 /100 | #253 | Tragic 97.6% |
| Immigrants | Congo | 0.7 /100 | #254 | Tragic 97.6% |
| Immigrants | Asia | 0.7 /100 | #255 | Tragic 97.6% |
| Yaqui | 0.6 /100 | #256 | Tragic 97.6% |
| Immigrants | Colombia | 0.6 /100 | #257 | Tragic 97.6% |
| Jamaicans | 0.6 /100 | #258 | Tragic 97.6% |
Demographics Similar to Immigrants from Europe by Nursery School
In terms of nursery school, the demographic groups most similar to Immigrants from Europe are Spaniard (98.2%, a difference of 0.0%), Seminole (98.2%, a difference of 0.0%), Cambodian (98.2%, a difference of 0.010%), Immigrants from Croatia (98.2%, a difference of 0.010%), and Immigrants from Bulgaria (98.1%, a difference of 0.010%).
| Demographics | Rating | Rank | Nursery School |
| Menominee | 93.6 /100 | #126 | Exceptional 98.2% |
| Immigrants | Saudi Arabia | 93.4 /100 | #127 | Exceptional 98.2% |
| Immigrants | Serbia | 92.4 /100 | #128 | Exceptional 98.2% |
| Cambodians | 91.4 /100 | #129 | Exceptional 98.2% |
| Immigrants | Croatia | 91.4 /100 | #130 | Exceptional 98.2% |
| Spaniards | 91.1 /100 | #131 | Exceptional 98.2% |
| Seminole | 90.9 /100 | #132 | Exceptional 98.2% |
| Immigrants | Europe | 90.7 /100 | #133 | Exceptional 98.1% |
| Immigrants | Bulgaria | 89.4 /100 | #134 | Excellent 98.1% |
| Immigrants | Hungary | 89.3 /100 | #135 | Excellent 98.1% |
| Immigrants | Kuwait | 88.9 /100 | #136 | Excellent 98.1% |
| Israelis | 88.2 /100 | #137 | Excellent 98.1% |
| Immigrants | Romania | 88.0 /100 | #138 | Excellent 98.1% |
| Blackfeet | 87.5 /100 | #139 | Excellent 98.1% |
| Palestinians | 83.7 /100 | #140 | Excellent 98.1% |