Ethiopian vs Immigrants from England Bachelor's Degree

COMPARE

Ethiopian
Race
Ancestry
AfghanAfricanAlaska NativeAlaskan AthabascanAlbanianAleutAlsatianAmericanApacheArabArapahoArgentineanArmenianAssyrian/Chaldean/SyriacAustralianAustrianBahamianBangladeshiBarbadianBasqueBelgianBelizeanBermudanBhutaneseBlackfeetBolivianBrazilianBritishBritish West IndianBulgarianBurmeseCajunCambodianCanadianCape VerdeanCarpatho RusynCelticCentral AmericanCentral American IndianCherokeeCheyenneChickasawChileanChineseChippewaChoctawColombianColvilleComancheCosta RicanCreeCreekCroatianCrowCubanCypriotCzechCzechoslovakianDanishDelawareDominicanDutchDutch West IndianEastern EuropeanEcuadorianEgyptianEnglishEstonianEthiopianEuropeanFijianFilipinoFinnishFrenchFrench American IndianFrench CanadianGermanGerman RussianGhanaianGreekGuamanian/ChamorroGuatemalanGuyaneseHaitianHmongHonduranHopiHoumaHungarianIcelanderIndian (Asian)IndonesianInupiatIranianIraqiIrishIroquoisIsraeliItalianJamaicanJapaneseJordanianKenyanKiowaKoreanLaotianLatvianLebaneseLiberianLithuanianLumbeeLuxembourgerMacedonianMalaysianMalteseMarshalleseMenomineeMexicanMexican American IndianMongolianMoroccanNative HawaiianNavajoNepaleseNew ZealanderNicaraguanNigerianNorthern EuropeanNorwegianOkinawanOsageOttawaPaiutePakistaniPalestinianPanamanianParaguayanPennsylvania GermanPeruvianPimaPolishPortuguesePotawatomiPuebloPuerto RicanPuget Sound SalishRomanianRussianSalvadoranSamoanScandinavianScotch-IrishScottishSeminoleSenegaleseSerbianShoshoneSierra LeoneanSiouxSlavicSlovakSloveneSomaliSouth AfricanSouth AmericanSouth American IndianSoviet UnionSpaniardSpanishSpanish AmericanSpanish American IndianSri LankanSubsaharan AfricanSudaneseSwedishSwissSyrianTaiwaneseThaiTlingit-HaidaTohono O'OdhamTonganTrinidadian and TobagonianTsimshianTurkishU.S. Virgin IslanderUgandanUkrainianUruguayanUteVenezuelanVietnameseWelshWest IndianYakamaYaquiYugoslavianYumanYup'ikZimbabwean
Immigration
NonimmigrantsImmigrantsAfghanistanAfricaAlbaniaArgentinaArmeniaAsiaAustraliaAustriaBahamasBangladeshBarbadosBelarusBelgiumBelizeBoliviaBosnia and HerzegovinaBrazilBulgariaBurma/MyanmarCabo VerdeCambodiaCameroonCanadaCaribbeanCentral AmericaChileChinaColombiaCongoCosta RicaCroatiaCubaCzechoslovakiaDenmarkDominicaDominican RepublicEastern AfricaEastern AsiaEastern EuropeEcuadorEgyptEl SalvadorEritreaEthiopiaEuropeFijiFranceGermanyGhanaGreeceGrenadaGuatemalaGuyanaHaitiHondurasHong KongHungaryIndiaIndonesiaIranIraqIrelandIsraelItalyJamaicaJapanJordanKazakhstanKenyaKoreaKuwaitLaosLatin AmericaLatviaLebanonLiberiaLithuaniaMalaysiaMexicoMicronesiaMiddle AfricaMoldovaMoroccoNepalNetherlandsNicaraguaNigeriaNorth AmericaNorth MacedoniaNorthern AfricaNorthern EuropeNorwayOceaniaPakistanPanamaPeruPhilippinesPolandPortugalRomaniaRussiaSaudi ArabiaScotlandSenegalSerbiaSierra LeoneSingaporeSomaliaSouth AfricaSouth AmericaSouth Central AsiaSouth Eastern AsiaSouthern EuropeSpainSri LankaSt. Vincent and the GrenadinesSudanSwedenSwitzerlandSyriaTaiwanThailandTrinidad and TobagoTurkeyUgandaUkraineUruguayUzbekistanVenezuelaVietnamWest IndiesWestern AfricaWestern AsiaWestern EuropeYemenZaireZimbabweAzores
Immigrants from England
Race
Ancestry
AfghanAfricanAlaska NativeAlaskan AthabascanAlbanianAleutAlsatianAmericanApacheArabArapahoArgentineanArmenianAssyrian/Chaldean/SyriacAustralianAustrianBahamianBangladeshiBarbadianBasqueBelgianBelizeanBermudanBhutaneseBlackfeetBolivianBrazilianBritishBritish West IndianBulgarianBurmeseCajunCambodianCanadianCape VerdeanCarpatho RusynCelticCentral AmericanCentral American IndianCherokeeCheyenneChickasawChileanChineseChippewaChoctawColombianColvilleComancheCosta RicanCreeCreekCroatianCrowCubanCypriotCzechCzechoslovakianDanishDelawareDominicanDutchDutch West IndianEastern EuropeanEcuadorianEgyptianEnglishEstonianEuropeanFijianFilipinoFinnishFrenchFrench American IndianFrench CanadianGermanGerman RussianGhanaianGreekGuamanian/ChamorroGuatemalanGuyaneseHaitianHmongHonduranHopiHoumaHungarianIcelanderIndian (Asian)IndonesianInupiatIranianIraqiIrishIroquoisIsraeliItalianJamaicanJapaneseJordanianKenyanKiowaKoreanLaotianLatvianLebaneseLiberianLithuanianLumbeeLuxembourgerMacedonianMalaysianMalteseMarshalleseMenomineeMexicanMexican American IndianMongolianMoroccanNative HawaiianNavajoNepaleseNew ZealanderNicaraguanNigerianNorthern EuropeanNorwegianOkinawanOsageOttawaPaiutePakistaniPalestinianPanamanianParaguayanPennsylvania GermanPeruvianPimaPolishPortuguesePotawatomiPuebloPuerto RicanPuget Sound SalishRomanianRussianSalvadoranSamoanScandinavianScotch-IrishScottishSeminoleSenegaleseSerbianShoshoneSierra LeoneanSiouxSlavicSlovakSloveneSomaliSouth AfricanSouth AmericanSouth American IndianSoviet UnionSpaniardSpanishSpanish AmericanSpanish American IndianSri LankanSubsaharan AfricanSudaneseSwedishSwissSyrianTaiwaneseThaiTlingit-HaidaTohono O'OdhamTonganTrinidadian and TobagonianTsimshianTurkishU.S. Virgin IslanderUgandanUkrainianUruguayanUteVenezuelanVietnameseWelshWest IndianYakamaYaquiYugoslavianYumanYup'ikZimbabwean
Immigration
NonimmigrantsImmigrantsAfghanistanAfricaAlbaniaArgentinaArmeniaAsiaAustraliaAustriaBahamasBangladeshBarbadosBelarusBelgiumBelizeBoliviaBosnia and HerzegovinaBrazilBulgariaBurma/MyanmarCabo VerdeCambodiaCameroonCanadaCaribbeanCentral AmericaChileChinaColombiaCongoCosta RicaCroatiaCubaCzechoslovakiaDenmarkDominicaDominican RepublicEastern AfricaEastern AsiaEastern EuropeEcuadorEgyptEl SalvadorEnglandEritreaEthiopiaEuropeFijiFranceGermanyGhanaGreeceGrenadaGuatemalaGuyanaHaitiHondurasHong KongHungaryIndiaIndonesiaIranIraqIrelandIsraelItalyJamaicaJapanJordanKazakhstanKenyaKoreaKuwaitLaosLatin AmericaLatviaLebanonLiberiaLithuaniaMalaysiaMexicoMicronesiaMiddle AfricaMoldovaMoroccoNepalNetherlandsNicaraguaNigeriaNorth AmericaNorth MacedoniaNorthern AfricaNorthern EuropeNorwayOceaniaPakistanPanamaPeruPhilippinesPolandPortugalRomaniaRussiaSaudi ArabiaScotlandSenegalSerbiaSierra LeoneSingaporeSomaliaSouth AfricaSouth AmericaSouth Central AsiaSouth Eastern AsiaSouthern EuropeSpainSri LankaSt. Vincent and the GrenadinesSudanSwedenSwitzerlandSyriaTaiwanThailandTrinidad and TobagoTurkeyUgandaUkraineUruguayUzbekistanVenezuelaVietnamWest IndiesWestern AfricaWestern AsiaWestern EuropeYemenZaireZimbabweAzores
Bachelor's Degree
Income
Poverty
Unemployment
Labor Participation
Family Structure
Vehicle Availability
Education Level
Disability

Bachelor's Degree Comparison

Ethiopians

Immigrants from England

Exceptional
Exceptional
42.8%
BACHELOR'S DEGREE
99.5/ 100
METRIC RATING
72nd/ 347
METRIC RANK
41.4%
BACHELOR'S DEGREE
98.1/ 100
METRIC RATING
99th/ 347
METRIC RANK

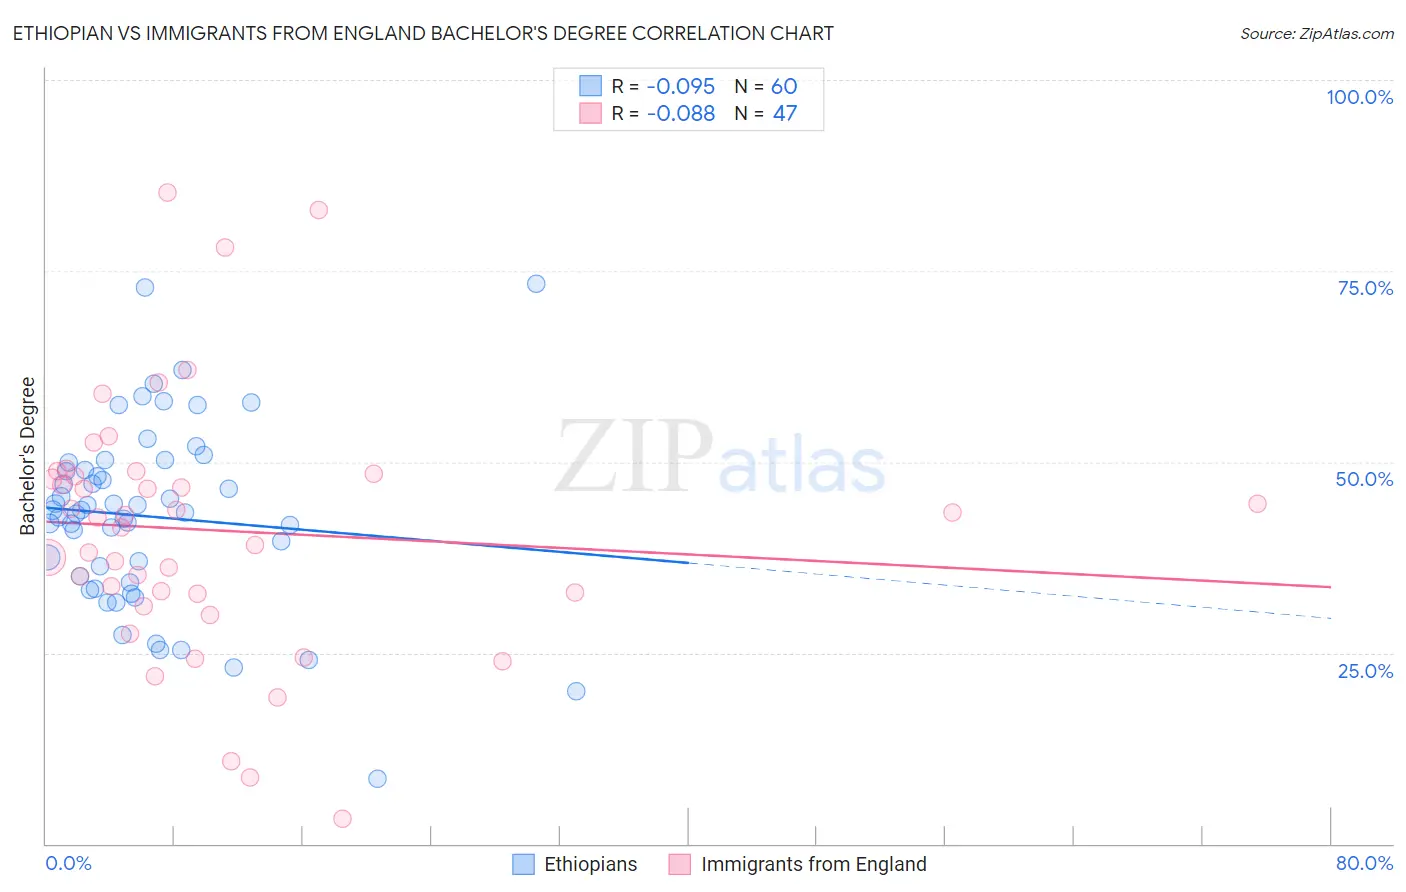
Ethiopian vs Immigrants from England Bachelor's Degree Correlation Chart

The statistical analysis conducted on geographies consisting of 223,255,026 people shows a slight negative correlation between the proportion of Ethiopians and percentage of population with at least bachelor's degree education in the United States with a correlation coefficient (R) of -0.095 and weighted average of 42.8%. Similarly, the statistical analysis conducted on geographies consisting of 391,879,677 people shows a slight negative correlation between the proportion of Immigrants from England and percentage of population with at least bachelor's degree education in the United States with a correlation coefficient (R) of -0.088 and weighted average of 41.4%, a difference of 3.2%.
Ethiopian vs Immigrants from England Bachelor's Degree

Bachelor's Degree Correlation Summary

MeasurementEthiopianImmigrants from England
Minimum8.5%3.3%
Maximum73.3%85.3%
Range64.9%82.0%
Mean42.8%41.0%
Median43.5%42.7%
Interquartile 25% (IQ1)34.6%32.7%
Interquartile 75% (IQ3)49.4%48.4%
Interquartile Range (IQR)14.8%15.7%
Standard Deviation (Sample)12.2%16.7%
Standard Deviation (Population)12.1%16.6%

Similar Demographics by Bachelor's Degree

Demographics Similar to Ethiopians by Bachelor's Degree

In terms of bachelor's degree, the demographic groups most similar to Ethiopians are Immigrants from Uzbekistan (42.8%, a difference of 0.050%), Immigrants from Argentina (42.8%, a difference of 0.090%), Bhutanese (42.7%, a difference of 0.27%), Immigrants from Romania (42.9%, a difference of 0.35%), and Immigrants from Zimbabwe (42.6%, a difference of 0.48%).
DemographicsRating | RankBachelor's Degree
Zimbabweans
99.7
/100
|
#65
Exceptional
43.3%
Immigrants | Netherlands
99.7
/100
|
#66
Exceptional
43.3%
Egyptians
99.7
/100
|
#67
Exceptional
43.3%
Immigrants | Indonesia
99.7
/100
|
#68
Exceptional
43.3%
Immigrants | Pakistan
99.7
/100
|
#69
Exceptional
43.1%
Immigrants | Romania
99.6
/100
|
#70
Exceptional
42.9%
Immigrants | Argentina
99.6
/100
|
#71
Exceptional
42.8%
Ethiopians
99.5
/100
|
#72
Exceptional
42.8%
Immigrants | Uzbekistan
99.5
/100
|
#73
Exceptional
42.8%
Bhutanese
99.5
/100
|
#74
Exceptional
42.7%
Immigrants | Zimbabwe
99.4
/100
|
#75
Exceptional
42.6%
Immigrants | Egypt
99.4
/100
|
#76
Exceptional
42.6%
Immigrants | Eastern Europe
99.4
/100
|
#77
Exceptional
42.5%
Immigrants | Ethiopia
99.4
/100
|
#78
Exceptional
42.5%
Immigrants | Lebanon
99.3
/100
|
#79
Exceptional
42.4%

Demographics Similar to Immigrants from England by Bachelor's Degree

In terms of bachelor's degree, the demographic groups most similar to Immigrants from England are Macedonian (41.4%, a difference of 0.030%), Immigrants from Morocco (41.4%, a difference of 0.060%), Immigrants from Ukraine (41.5%, a difference of 0.24%), Immigrants from Italy (41.3%, a difference of 0.32%), and Romanian (41.6%, a difference of 0.35%).
DemographicsRating | RankBachelor's Degree
Maltese
98.8
/100
|
#92
Exceptional
41.9%
Immigrants | Canada
98.6
/100
|
#93
Exceptional
41.7%
Immigrants | Nepal
98.6
/100
|
#94
Exceptional
41.7%
Immigrants | North America
98.5
/100
|
#95
Exceptional
41.7%
Immigrants | Moldova
98.4
/100
|
#96
Exceptional
41.6%
Romanians
98.4
/100
|
#97
Exceptional
41.6%
Immigrants | Ukraine
98.3
/100
|
#98
Exceptional
41.5%
Immigrants | England
98.1
/100
|
#99
Exceptional
41.4%
Macedonians
98.1
/100
|
#100
Exceptional
41.4%
Immigrants | Morocco
98.0
/100
|
#101
Exceptional
41.4%
Immigrants | Italy
97.8
/100
|
#102
Exceptional
41.3%
Chileans
97.5
/100
|
#103
Exceptional
41.2%
Jordanians
97.4
/100
|
#104
Exceptional
41.2%
Syrians
97.4
/100
|
#105
Exceptional
41.1%
Alsatians
97.0
/100
|
#106
Exceptional
41.0%