Ethiopian vs Comanche In Labor Force | Age 35-44
COMPARE
Ethiopian
Comanche
In Labor Force | Age 35-44
In Labor Force | Age 35-44 Comparison
Ethiopians
Comanche
85.9%
IN LABOR FORCE | AGE 35-44
100.0/ 100
METRIC RATING
9th/ 347
METRIC RANK
81.5%
IN LABOR FORCE | AGE 35-44
0.0/ 100
METRIC RATING
316th/ 347
METRIC RANK
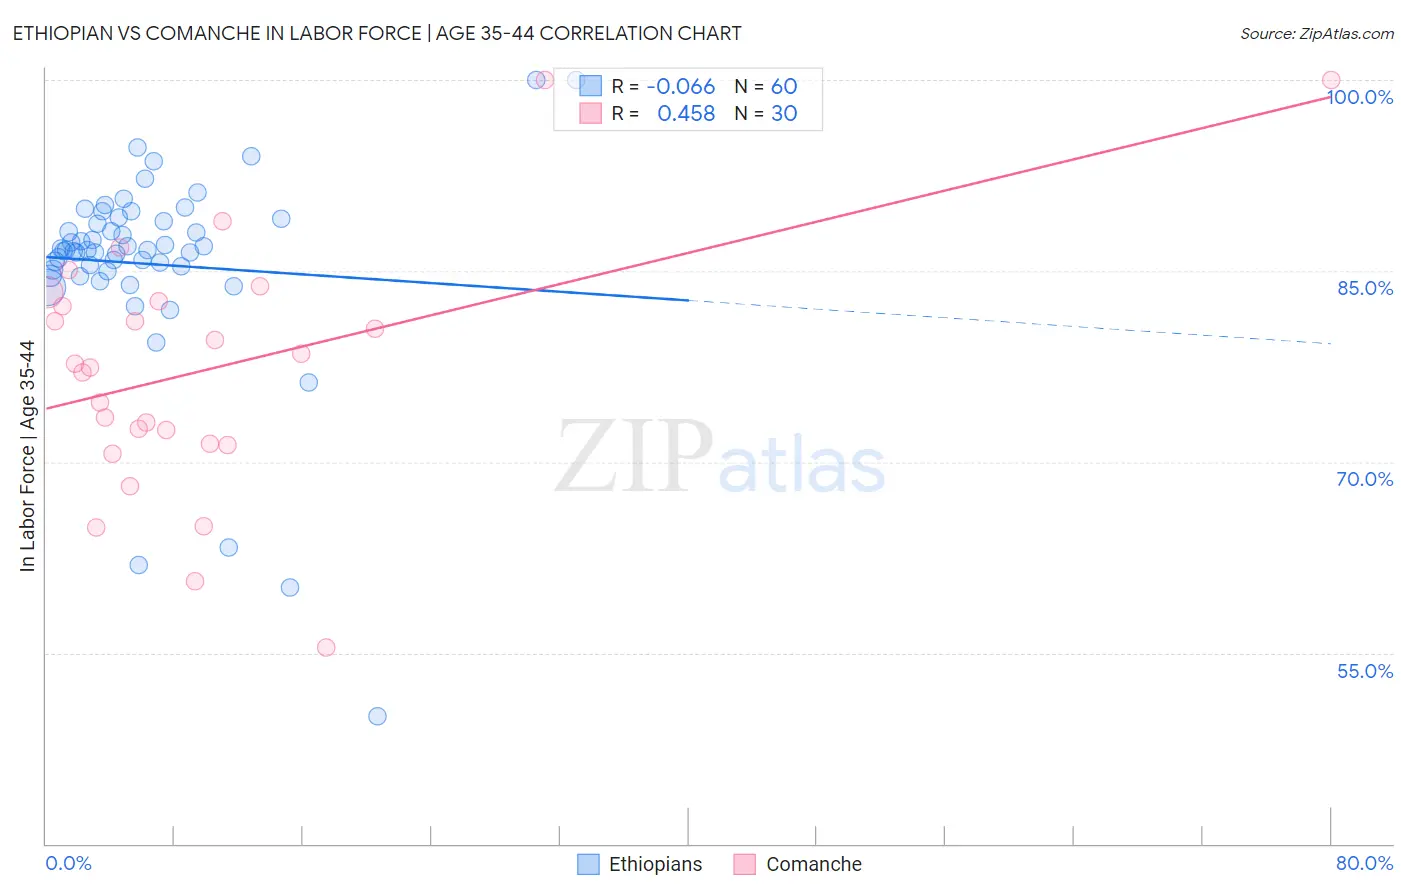
Ethiopian vs Comanche In Labor Force | Age 35-44 Correlation Chart
The statistical analysis conducted on geographies consisting of 223,141,148 people shows a slight negative correlation between the proportion of Ethiopians and labor force participation rate among population between the ages 35 and 44 in the United States with a correlation coefficient (R) of -0.066 and weighted average of 85.9%. Similarly, the statistical analysis conducted on geographies consisting of 109,773,192 people shows a moderate positive correlation between the proportion of Comanche and labor force participation rate among population between the ages 35 and 44 in the United States with a correlation coefficient (R) of 0.458 and weighted average of 81.5%, a difference of 5.4%.
In Labor Force | Age 35-44 Correlation Summary
| Measurement | Ethiopian | Comanche |
| Minimum | 50.0% | 55.4% |
| Maximum | 100.0% | 100.0% |
| Range | 50.0% | 44.6% |
| Mean | 85.5% | 77.3% |
| Median | 86.7% | 77.6% |
| Interquartile 25% (IQ1) | 85.0% | 71.4% |
| Interquartile 75% (IQ3) | 89.0% | 82.6% |
| Interquartile Range (IQR) | 3.9% | 11.2% |
| Standard Deviation (Sample) | 8.3% | 9.9% |
| Standard Deviation (Population) | 8.2% | 9.7% |
Similar Demographics by In Labor Force | Age 35-44
Demographics Similar to Ethiopians by In Labor Force | Age 35-44
In terms of in labor force | age 35-44, the demographic groups most similar to Ethiopians are Immigrants from Ethiopia (85.9%, a difference of 0.0%), Cape Verdean (85.8%, a difference of 0.13%), Immigrants from Cameroon (85.8%, a difference of 0.16%), Immigrants from Sierra Leone (86.1%, a difference of 0.18%), and Bolivian (86.1%, a difference of 0.21%).
| Demographics | Rating | Rank | In Labor Force | Age 35-44 |
| Luxembourgers | 100.0 /100 | #2 | Exceptional 86.4% |
| Immigrants | Bolivia | 100.0 /100 | #3 | Exceptional 86.2% |
| Immigrants | Cabo Verde | 100.0 /100 | #4 | Exceptional 86.2% |
| Zimbabweans | 100.0 /100 | #5 | Exceptional 86.1% |
| Bolivians | 100.0 /100 | #6 | Exceptional 86.1% |
| Immigrants | Sierra Leone | 100.0 /100 | #7 | Exceptional 86.1% |
| Immigrants | Ethiopia | 100.0 /100 | #8 | Exceptional 85.9% |
| Ethiopians | 100.0 /100 | #9 | Exceptional 85.9% |
| Cape Verdeans | 100.0 /100 | #10 | Exceptional 85.8% |
| Immigrants | Cameroon | 100.0 /100 | #11 | Exceptional 85.8% |
| Liberians | 100.0 /100 | #12 | Exceptional 85.7% |
| Somalis | 100.0 /100 | #13 | Exceptional 85.6% |
| Immigrants | Somalia | 100.0 /100 | #14 | Exceptional 85.6% |
| Norwegians | 100.0 /100 | #15 | Exceptional 85.6% |
| Immigrants | Ireland | 100.0 /100 | #16 | Exceptional 85.6% |
Demographics Similar to Comanche by In Labor Force | Age 35-44
In terms of in labor force | age 35-44, the demographic groups most similar to Comanche are Immigrants from Mexico (81.5%, a difference of 0.020%), Cajun (81.5%, a difference of 0.050%), Cherokee (81.4%, a difference of 0.080%), Alaska Native (81.6%, a difference of 0.16%), and Mexican (81.6%, a difference of 0.16%).
| Demographics | Rating | Rank | In Labor Force | Age 35-44 |
| Cree | 0.0 /100 | #309 | Tragic 82.0% |
| Blackfeet | 0.0 /100 | #310 | Tragic 81.9% |
| Colville | 0.0 /100 | #311 | Tragic 81.7% |
| Alaska Natives | 0.0 /100 | #312 | Tragic 81.6% |
| Mexicans | 0.0 /100 | #313 | Tragic 81.6% |
| Cajuns | 0.0 /100 | #314 | Tragic 81.5% |
| Immigrants | Mexico | 0.0 /100 | #315 | Tragic 81.5% |
| Comanche | 0.0 /100 | #316 | Tragic 81.5% |
| Cherokee | 0.0 /100 | #317 | Tragic 81.4% |
| Alaskan Athabascans | 0.0 /100 | #318 | Tragic 81.3% |
| Inupiat | 0.0 /100 | #319 | Tragic 80.9% |
| Chickasaw | 0.0 /100 | #320 | Tragic 80.9% |
| Puerto Ricans | 0.0 /100 | #321 | Tragic 80.7% |
| Paiute | 0.0 /100 | #322 | Tragic 80.6% |
| Yaqui | 0.0 /100 | #323 | Tragic 80.5% |