Ethiopian vs Guamanian/Chamorro Bachelor's Degree

COMPARE

Ethiopian
Race
Ancestry
AfghanAfricanAlaska NativeAlaskan AthabascanAlbanianAleutAlsatianAmericanApacheArabArapahoArgentineanArmenianAssyrian/Chaldean/SyriacAustralianAustrianBahamianBangladeshiBarbadianBasqueBelgianBelizeanBermudanBhutaneseBlackfeetBolivianBrazilianBritishBritish West IndianBulgarianBurmeseCajunCambodianCanadianCape VerdeanCarpatho RusynCelticCentral AmericanCentral American IndianCherokeeCheyenneChickasawChileanChineseChippewaChoctawColombianColvilleComancheCosta RicanCreeCreekCroatianCrowCubanCypriotCzechCzechoslovakianDanishDelawareDominicanDutchDutch West IndianEastern EuropeanEcuadorianEgyptianEnglishEstonianEthiopianEuropeanFijianFilipinoFinnishFrenchFrench American IndianFrench CanadianGermanGerman RussianGhanaianGreekGuatemalanGuyaneseHaitianHmongHonduranHopiHoumaHungarianIcelanderIndian (Asian)IndonesianInupiatIranianIraqiIrishIroquoisIsraeliItalianJamaicanJapaneseJordanianKenyanKiowaKoreanLaotianLatvianLebaneseLiberianLithuanianLumbeeLuxembourgerMacedonianMalaysianMalteseMarshalleseMenomineeMexicanMexican American IndianMongolianMoroccanNative HawaiianNavajoNepaleseNew ZealanderNicaraguanNigerianNorthern EuropeanNorwegianOkinawanOsageOttawaPaiutePakistaniPalestinianPanamanianParaguayanPennsylvania GermanPeruvianPimaPolishPortuguesePotawatomiPuebloPuerto RicanPuget Sound SalishRomanianRussianSalvadoranSamoanScandinavianScotch-IrishScottishSeminoleSenegaleseSerbianShoshoneSierra LeoneanSiouxSlavicSlovakSloveneSomaliSouth AfricanSouth AmericanSouth American IndianSoviet UnionSpaniardSpanishSpanish AmericanSpanish American IndianSri LankanSubsaharan AfricanSudaneseSwedishSwissSyrianTaiwaneseThaiTlingit-HaidaTohono O'OdhamTonganTrinidadian and TobagonianTsimshianTurkishU.S. Virgin IslanderUgandanUkrainianUruguayanUteVenezuelanVietnameseWelshWest IndianYakamaYaquiYugoslavianYumanYup'ikZimbabwean
Immigration
NonimmigrantsImmigrantsAfghanistanAfricaAlbaniaArgentinaArmeniaAsiaAustraliaAustriaBahamasBangladeshBarbadosBelarusBelgiumBelizeBoliviaBosnia and HerzegovinaBrazilBulgariaBurma/MyanmarCabo VerdeCambodiaCameroonCanadaCaribbeanCentral AmericaChileChinaColombiaCongoCosta RicaCroatiaCubaCzechoslovakiaDenmarkDominicaDominican RepublicEastern AfricaEastern AsiaEastern EuropeEcuadorEgyptEl SalvadorEnglandEritreaEthiopiaEuropeFijiFranceGermanyGhanaGreeceGrenadaGuatemalaGuyanaHaitiHondurasHong KongHungaryIndiaIndonesiaIranIraqIrelandIsraelItalyJamaicaJapanJordanKazakhstanKenyaKoreaKuwaitLaosLatin AmericaLatviaLebanonLiberiaLithuaniaMalaysiaMexicoMicronesiaMiddle AfricaMoldovaMoroccoNepalNetherlandsNicaraguaNigeriaNorth AmericaNorth MacedoniaNorthern AfricaNorthern EuropeNorwayOceaniaPakistanPanamaPeruPhilippinesPolandPortugalRomaniaRussiaSaudi ArabiaScotlandSenegalSerbiaSierra LeoneSingaporeSomaliaSouth AfricaSouth AmericaSouth Central AsiaSouth Eastern AsiaSouthern EuropeSpainSri LankaSt. Vincent and the GrenadinesSudanSwedenSwitzerlandSyriaTaiwanThailandTrinidad and TobagoTurkeyUgandaUkraineUruguayUzbekistanVenezuelaVietnamWest IndiesWestern AfricaWestern AsiaWestern EuropeYemenZaireZimbabweAzores
Guamanian/Chamorro
Race
Ancestry
AfghanAfricanAlaska NativeAlaskan AthabascanAlbanianAleutAlsatianAmericanApacheArabArapahoArgentineanArmenianAssyrian/Chaldean/SyriacAustralianAustrianBahamianBangladeshiBarbadianBasqueBelgianBelizeanBermudanBhutaneseBlackfeetBolivianBrazilianBritishBritish West IndianBulgarianBurmeseCajunCambodianCanadianCape VerdeanCarpatho RusynCelticCentral AmericanCentral American IndianCherokeeCheyenneChickasawChileanChineseChippewaChoctawColombianColvilleComancheCosta RicanCreeCreekCroatianCrowCubanCypriotCzechCzechoslovakianDanishDelawareDominicanDutchDutch West IndianEastern EuropeanEcuadorianEgyptianEnglishEstonianEuropeanFijianFilipinoFinnishFrenchFrench American IndianFrench CanadianGermanGerman RussianGhanaianGreekGuamanian/ChamorroGuatemalanGuyaneseHaitianHmongHonduranHopiHoumaHungarianIcelanderIndian (Asian)IndonesianInupiatIranianIraqiIrishIroquoisIsraeliItalianJamaicanJapaneseJordanianKenyanKiowaKoreanLaotianLatvianLebaneseLiberianLithuanianLumbeeLuxembourgerMacedonianMalaysianMalteseMarshalleseMenomineeMexicanMexican American IndianMongolianMoroccanNative HawaiianNavajoNepaleseNew ZealanderNicaraguanNigerianNorthern EuropeanNorwegianOkinawanOsageOttawaPaiutePakistaniPalestinianPanamanianParaguayanPennsylvania GermanPeruvianPimaPolishPortuguesePotawatomiPuebloPuerto RicanPuget Sound SalishRomanianRussianSalvadoranSamoanScandinavianScotch-IrishScottishSeminoleSenegaleseSerbianShoshoneSierra LeoneanSiouxSlavicSlovakSloveneSomaliSouth AfricanSouth AmericanSouth American IndianSoviet UnionSpaniardSpanishSpanish AmericanSpanish American IndianSri LankanSubsaharan AfricanSudaneseSwedishSwissSyrianTaiwaneseThaiTlingit-HaidaTohono O'OdhamTonganTrinidadian and TobagonianTsimshianTurkishU.S. Virgin IslanderUgandanUkrainianUruguayanUteVenezuelanVietnameseWelshWest IndianYakamaYaquiYugoslavianYumanYup'ikZimbabwean
Immigration
NonimmigrantsImmigrantsAfghanistanAfricaAlbaniaArgentinaArmeniaAsiaAustraliaAustriaBahamasBangladeshBarbadosBelarusBelgiumBelizeBoliviaBosnia and HerzegovinaBrazilBulgariaBurma/MyanmarCabo VerdeCambodiaCameroonCanadaCaribbeanCentral AmericaChileChinaColombiaCongoCosta RicaCroatiaCubaCzechoslovakiaDenmarkDominicaDominican RepublicEastern AfricaEastern AsiaEastern EuropeEcuadorEgyptEl SalvadorEnglandEritreaEthiopiaEuropeFijiFranceGermanyGhanaGreeceGrenadaGuatemalaGuyanaHaitiHondurasHong KongHungaryIndiaIndonesiaIranIraqIrelandIsraelItalyJamaicaJapanJordanKazakhstanKenyaKoreaKuwaitLaosLatin AmericaLatviaLebanonLiberiaLithuaniaMalaysiaMexicoMicronesiaMiddle AfricaMoldovaMoroccoNepalNetherlandsNicaraguaNigeriaNorth AmericaNorth MacedoniaNorthern AfricaNorthern EuropeNorwayOceaniaPakistanPanamaPeruPhilippinesPolandPortugalRomaniaRussiaSaudi ArabiaScotlandSenegalSerbiaSierra LeoneSingaporeSomaliaSouth AfricaSouth AmericaSouth Central AsiaSouth Eastern AsiaSouthern EuropeSpainSri LankaSt. Vincent and the GrenadinesSudanSwedenSwitzerlandSyriaTaiwanThailandTrinidad and TobagoTurkeyUgandaUkraineUruguayUzbekistanVenezuelaVietnamWest IndiesWestern AfricaWestern AsiaWestern EuropeYemenZaireZimbabweAzores
Bachelor's Degree
Income
Poverty
Unemployment
Labor Participation
Family Structure
Vehicle Availability
Education Level
Disability

Bachelor's Degree Comparison

Ethiopians

Guamanians/Chamorros

Exceptional
Tragic
42.8%
BACHELOR'S DEGREE
99.5/ 100
METRIC RATING
72nd/ 347
METRIC RANK
34.6%
BACHELOR'S DEGREE
3.0/ 100
METRIC RATING
234th/ 347
METRIC RANK

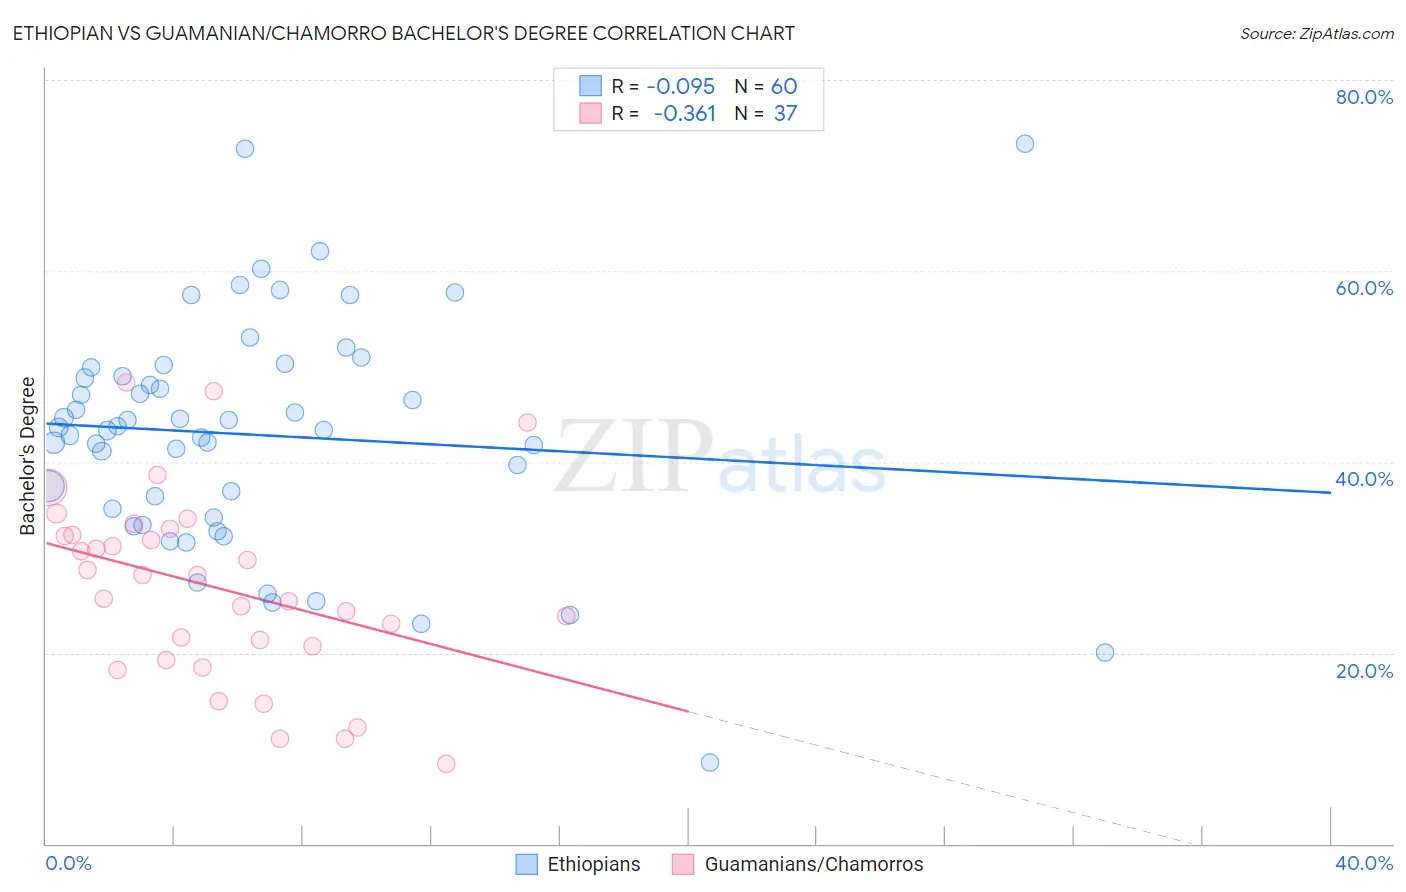
Ethiopian vs Guamanian/Chamorro Bachelor's Degree Correlation Chart

The statistical analysis conducted on geographies consisting of 223,255,026 people shows a slight negative correlation between the proportion of Ethiopians and percentage of population with at least bachelor's degree education in the United States with a correlation coefficient (R) of -0.095 and weighted average of 42.8%. Similarly, the statistical analysis conducted on geographies consisting of 221,963,631 people shows a mild negative correlation between the proportion of Guamanians/Chamorros and percentage of population with at least bachelor's degree education in the United States with a correlation coefficient (R) of -0.361 and weighted average of 34.6%, a difference of 23.5%.
Ethiopian vs Guamanian/Chamorro Bachelor's Degree

Bachelor's Degree Correlation Summary

MeasurementEthiopianGuamanian/Chamorro
Minimum8.5%8.3%
Maximum73.3%48.4%
Range64.9%40.0%
Mean42.8%26.9%
Median43.5%28.2%
Interquartile 25% (IQ1)34.6%20.0%
Interquartile 75% (IQ3)49.4%32.6%
Interquartile Range (IQR)14.8%12.7%
Standard Deviation (Sample)12.2%9.8%
Standard Deviation (Population)12.1%9.7%

Similar Demographics by Bachelor's Degree

Demographics Similar to Ethiopians by Bachelor's Degree

In terms of bachelor's degree, the demographic groups most similar to Ethiopians are Immigrants from Uzbekistan (42.8%, a difference of 0.050%), Immigrants from Argentina (42.8%, a difference of 0.090%), Bhutanese (42.7%, a difference of 0.27%), Immigrants from Romania (42.9%, a difference of 0.35%), and Immigrants from Zimbabwe (42.6%, a difference of 0.48%).
DemographicsRating | RankBachelor's Degree
Zimbabweans
99.7
/100
|
#65
Exceptional
43.3%
Immigrants | Netherlands
99.7
/100
|
#66
Exceptional
43.3%
Egyptians
99.7
/100
|
#67
Exceptional
43.3%
Immigrants | Indonesia
99.7
/100
|
#68
Exceptional
43.3%
Immigrants | Pakistan
99.7
/100
|
#69
Exceptional
43.1%
Immigrants | Romania
99.6
/100
|
#70
Exceptional
42.9%
Immigrants | Argentina
99.6
/100
|
#71
Exceptional
42.8%
Ethiopians
99.5
/100
|
#72
Exceptional
42.8%
Immigrants | Uzbekistan
99.5
/100
|
#73
Exceptional
42.8%
Bhutanese
99.5
/100
|
#74
Exceptional
42.7%
Immigrants | Zimbabwe
99.4
/100
|
#75
Exceptional
42.6%
Immigrants | Egypt
99.4
/100
|
#76
Exceptional
42.6%
Immigrants | Eastern Europe
99.4
/100
|
#77
Exceptional
42.5%
Immigrants | Ethiopia
99.4
/100
|
#78
Exceptional
42.5%
Immigrants | Lebanon
99.3
/100
|
#79
Exceptional
42.4%

Demographics Similar to Guamanians/Chamorros by Bachelor's Degree

In terms of bachelor's degree, the demographic groups most similar to Guamanians/Chamorros are Immigrants from West Indies (34.6%, a difference of 0.090%), Liberian (34.6%, a difference of 0.20%), Immigrants from Ecuador (34.7%, a difference of 0.22%), Tlingit-Haida (34.6%, a difference of 0.24%), and Hmong (34.8%, a difference of 0.32%).
DemographicsRating | RankBachelor's Degree
Ecuadorians
6.6
/100
|
#227
Tragic
35.4%
Immigrants | Trinidad and Tobago
6.0
/100
|
#228
Tragic
35.3%
Whites/Caucasians
5.9
/100
|
#229
Tragic
35.3%
Immigrants | Grenada
4.3
/100
|
#230
Tragic
35.0%
Immigrants | St. Vincent and the Grenadines
4.3
/100
|
#231
Tragic
35.0%
Hmong
3.4
/100
|
#232
Tragic
34.8%
Immigrants | Ecuador
3.3
/100
|
#233
Tragic
34.7%
Guamanians/Chamorros
3.0
/100
|
#234
Tragic
34.6%
Immigrants | West Indies
2.9
/100
|
#235
Tragic
34.6%
Liberians
2.8
/100
|
#236
Tragic
34.6%
Tlingit-Haida
2.8
/100
|
#237
Tragic
34.6%
Guyanese
2.5
/100
|
#238
Tragic
34.5%
British West Indians
2.5
/100
|
#239
Tragic
34.5%
Tongans
2.0
/100
|
#240
Tragic
34.3%
Immigrants | Cambodia
1.9
/100
|
#241
Tragic
34.2%