Ethiopian vs Welsh Bachelor's Degree
COMPARE
Ethiopian
Welsh
Bachelor's Degree
Bachelor's Degree Comparison
Ethiopians
Welsh
42.8%
BACHELOR'S DEGREE
99.5/ 100
METRIC RATING
72nd/ 347
METRIC RANK
37.0%
BACHELOR'S DEGREE
29.1/ 100
METRIC RATING
198th/ 347
METRIC RANK
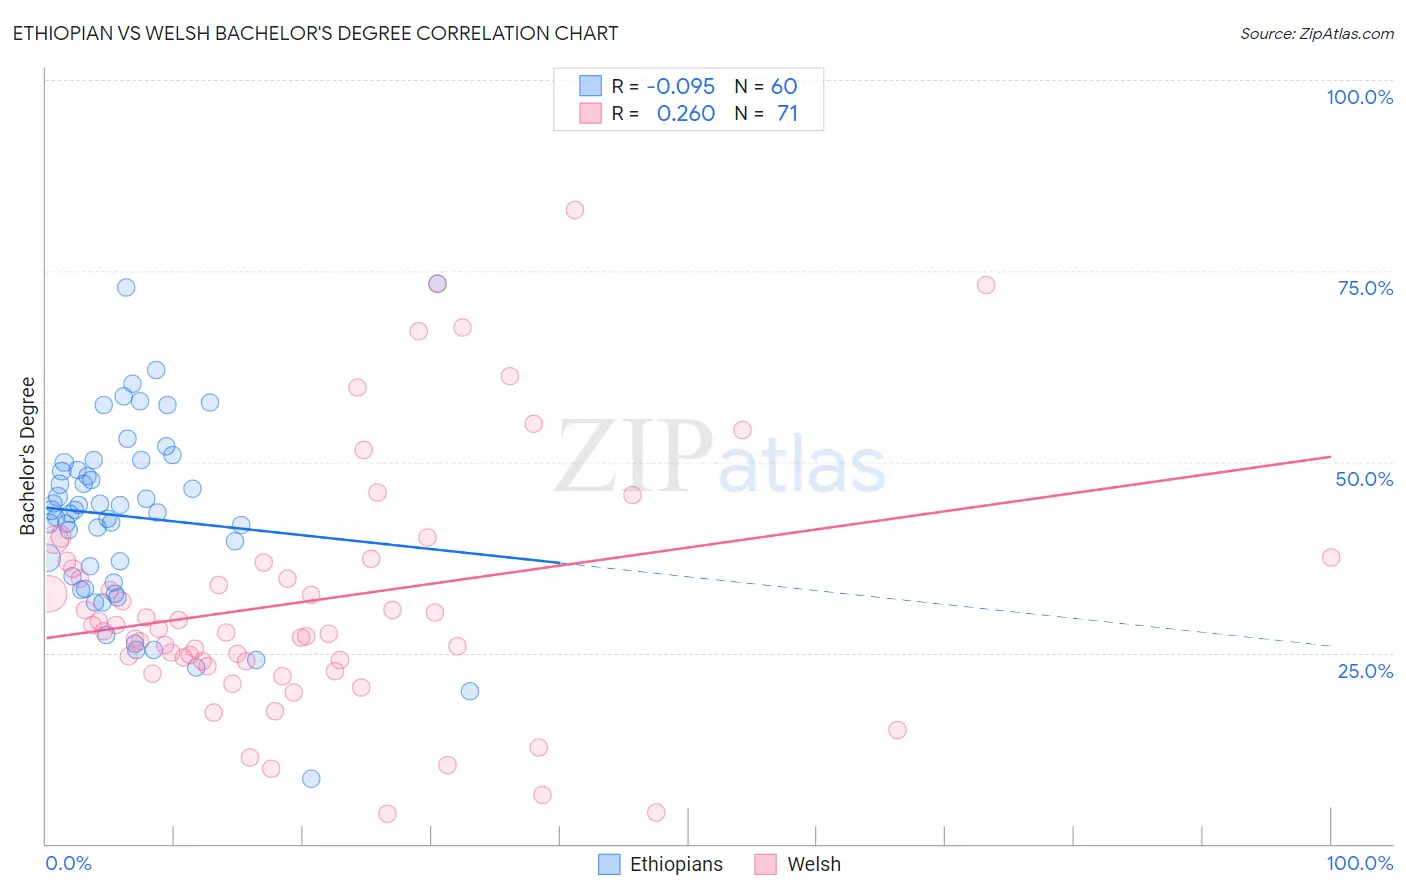
Ethiopian vs Welsh Bachelor's Degree Correlation Chart
The statistical analysis conducted on geographies consisting of 223,255,026 people shows a slight negative correlation between the proportion of Ethiopians and percentage of population with at least bachelor's degree education in the United States with a correlation coefficient (R) of -0.095 and weighted average of 42.8%. Similarly, the statistical analysis conducted on geographies consisting of 528,521,285 people shows a weak positive correlation between the proportion of Welsh and percentage of population with at least bachelor's degree education in the United States with a correlation coefficient (R) of 0.260 and weighted average of 37.0%, a difference of 15.6%.
Bachelor's Degree Correlation Summary
| Measurement | Ethiopian | Welsh |
| Minimum | 8.5% | 3.9% |
| Maximum | 73.3% | 83.0% |
| Range | 64.9% | 79.1% |
| Mean | 42.8% | 31.9% |
| Median | 43.5% | 28.2% |
| Interquartile 25% (IQ1) | 34.6% | 23.9% |
| Interquartile 75% (IQ3) | 49.4% | 36.9% |
| Interquartile Range (IQR) | 14.8% | 13.0% |
| Standard Deviation (Sample) | 12.2% | 16.3% |
| Standard Deviation (Population) | 12.1% | 16.2% |
Similar Demographics by Bachelor's Degree
Demographics Similar to Ethiopians by Bachelor's Degree
In terms of bachelor's degree, the demographic groups most similar to Ethiopians are Immigrants from Uzbekistan (42.8%, a difference of 0.050%), Immigrants from Argentina (42.8%, a difference of 0.090%), Bhutanese (42.7%, a difference of 0.27%), Immigrants from Romania (42.9%, a difference of 0.35%), and Immigrants from Zimbabwe (42.6%, a difference of 0.48%).
| Demographics | Rating | Rank | Bachelor's Degree |
| Zimbabweans | 99.7 /100 | #65 | Exceptional 43.3% |
| Immigrants | Netherlands | 99.7 /100 | #66 | Exceptional 43.3% |
| Egyptians | 99.7 /100 | #67 | Exceptional 43.3% |
| Immigrants | Indonesia | 99.7 /100 | #68 | Exceptional 43.3% |
| Immigrants | Pakistan | 99.7 /100 | #69 | Exceptional 43.1% |
| Immigrants | Romania | 99.6 /100 | #70 | Exceptional 42.9% |
| Immigrants | Argentina | 99.6 /100 | #71 | Exceptional 42.8% |
| Ethiopians | 99.5 /100 | #72 | Exceptional 42.8% |
| Immigrants | Uzbekistan | 99.5 /100 | #73 | Exceptional 42.8% |
| Bhutanese | 99.5 /100 | #74 | Exceptional 42.7% |
| Immigrants | Zimbabwe | 99.4 /100 | #75 | Exceptional 42.6% |
| Immigrants | Egypt | 99.4 /100 | #76 | Exceptional 42.6% |
| Immigrants | Eastern Europe | 99.4 /100 | #77 | Exceptional 42.5% |
| Immigrants | Ethiopia | 99.4 /100 | #78 | Exceptional 42.5% |
| Immigrants | Lebanon | 99.3 /100 | #79 | Exceptional 42.4% |
Demographics Similar to Welsh by Bachelor's Degree
In terms of bachelor's degree, the demographic groups most similar to Welsh are Czechoslovakian (37.0%, a difference of 0.010%), Celtic (37.0%, a difference of 0.050%), Korean (37.0%, a difference of 0.080%), Belgian (37.0%, a difference of 0.10%), and Immigrants from Costa Rica (36.9%, a difference of 0.21%).
| Demographics | Rating | Rank | Bachelor's Degree |
| Nigerians | 33.9 /100 | #191 | Fair 37.2% |
| Immigrants | Vietnam | 32.1 /100 | #192 | Fair 37.1% |
| Yugoslavians | 31.5 /100 | #193 | Fair 37.1% |
| Belgians | 29.9 /100 | #194 | Fair 37.0% |
| Koreans | 29.8 /100 | #195 | Fair 37.0% |
| Celtics | 29.5 /100 | #196 | Fair 37.0% |
| Czechoslovakians | 29.2 /100 | #197 | Fair 37.0% |
| Welsh | 29.1 /100 | #198 | Fair 37.0% |
| Immigrants | Costa Rica | 27.4 /100 | #199 | Fair 36.9% |
| Immigrants | Ghana | 27.4 /100 | #200 | Fair 36.9% |
| Immigrants | South Eastern Asia | 25.4 /100 | #201 | Fair 36.8% |
| Immigrants | Zaire | 25.3 /100 | #202 | Fair 36.8% |
| Immigrants | Nigeria | 23.1 /100 | #203 | Fair 36.7% |
| Immigrants | Immigrants | 22.8 /100 | #204 | Fair 36.7% |
| Finns | 22.2 /100 | #205 | Fair 36.7% |