Dominican vs Bulgarian Associate's Degree
COMPARE
Dominican
Bulgarian
Associate's Degree
Associate's Degree Comparison
Dominicans
Bulgarians
39.3%
ASSOCIATE'S DEGREE
0.0/ 100
METRIC RATING
291st/ 347
METRIC RANK
53.3%
ASSOCIATE'S DEGREE
100.0/ 100
METRIC RATING
34th/ 347
METRIC RANK
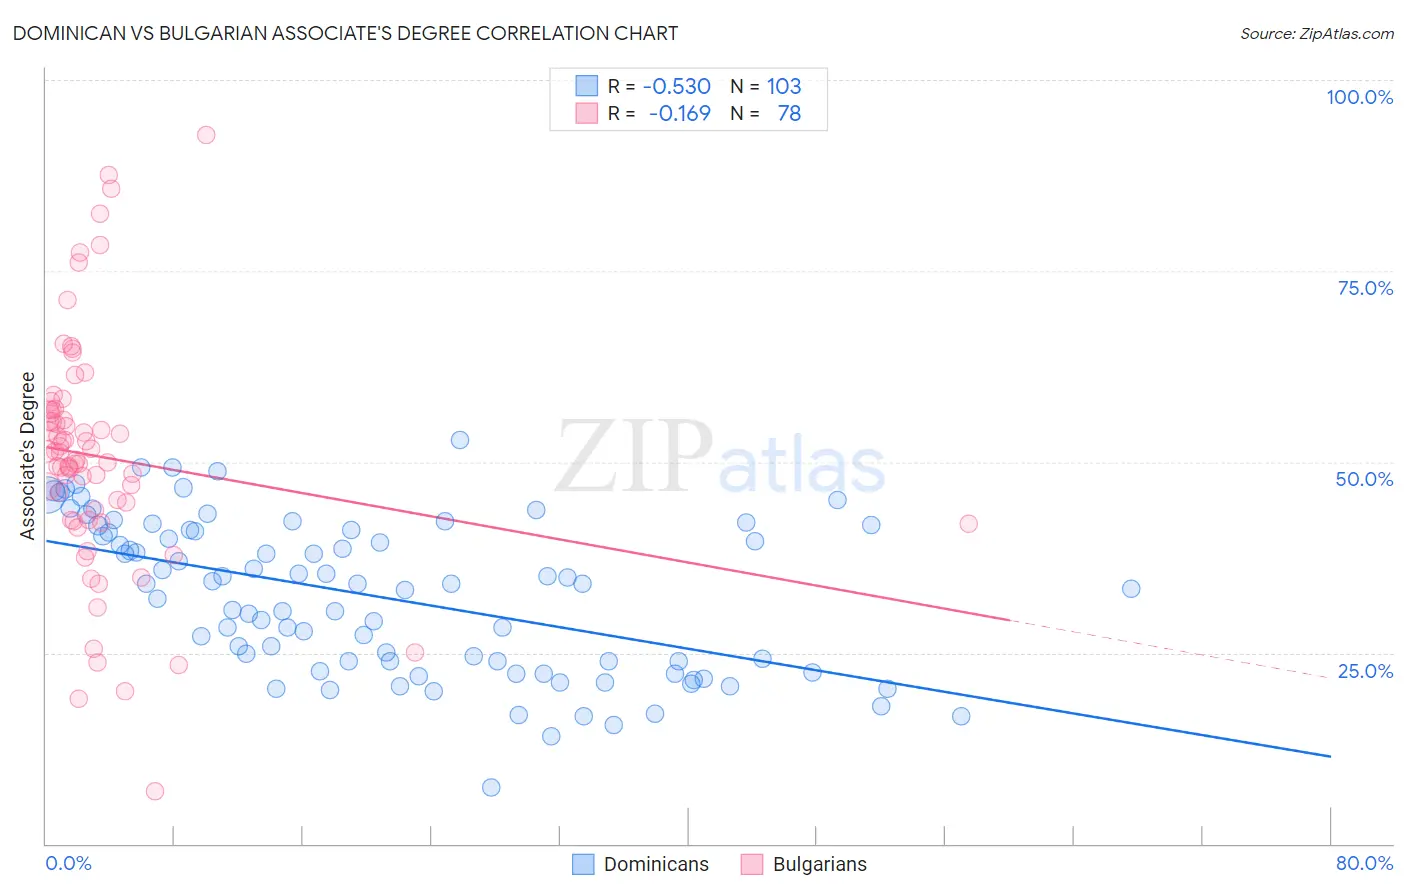
Dominican vs Bulgarian Associate's Degree Correlation Chart
The statistical analysis conducted on geographies consisting of 355,098,353 people shows a substantial negative correlation between the proportion of Dominicans and percentage of population with at least associate's degree education in the United States with a correlation coefficient (R) of -0.530 and weighted average of 39.3%. Similarly, the statistical analysis conducted on geographies consisting of 205,619,803 people shows a poor negative correlation between the proportion of Bulgarians and percentage of population with at least associate's degree education in the United States with a correlation coefficient (R) of -0.169 and weighted average of 53.3%, a difference of 35.7%.
Associate's Degree Correlation Summary
| Measurement | Dominican | Bulgarian |
| Minimum | 7.4% | 6.9% |
| Maximum | 52.8% | 92.7% |
| Range | 45.4% | 85.9% |
| Mean | 32.3% | 50.7% |
| Median | 34.0% | 50.7% |
| Interquartile 25% (IQ1) | 23.8% | 42.4% |
| Interquartile 75% (IQ3) | 41.0% | 56.8% |
| Interquartile Range (IQR) | 17.2% | 14.4% |
| Standard Deviation (Sample) | 10.0% | 15.5% |
| Standard Deviation (Population) | 10.0% | 15.4% |
Similar Demographics by Associate's Degree
Demographics Similar to Dominicans by Associate's Degree
In terms of associate's degree, the demographic groups most similar to Dominicans are Immigrants from Haiti (39.3%, a difference of 0.010%), Black/African American (39.1%, a difference of 0.29%), Central American (39.4%, a difference of 0.46%), Nepalese (39.0%, a difference of 0.54%), and Salvadoran (39.0%, a difference of 0.54%).
| Demographics | Rating | Rank | Associate's Degree |
| Comanche | 0.1 /100 | #284 | Tragic 39.9% |
| Immigrants | Belize | 0.1 /100 | #285 | Tragic 39.9% |
| Immigrants | Caribbean | 0.0 /100 | #286 | Tragic 39.7% |
| Aleuts | 0.0 /100 | #287 | Tragic 39.6% |
| Immigrants | Cuba | 0.0 /100 | #288 | Tragic 39.5% |
| Central Americans | 0.0 /100 | #289 | Tragic 39.4% |
| Immigrants | Haiti | 0.0 /100 | #290 | Tragic 39.3% |
| Dominicans | 0.0 /100 | #291 | Tragic 39.3% |
| Blacks/African Americans | 0.0 /100 | #292 | Tragic 39.1% |
| Nepalese | 0.0 /100 | #293 | Tragic 39.0% |
| Salvadorans | 0.0 /100 | #294 | Tragic 39.0% |
| Hondurans | 0.0 /100 | #295 | Tragic 38.9% |
| Cherokee | 0.0 /100 | #296 | Tragic 38.9% |
| Cape Verdeans | 0.0 /100 | #297 | Tragic 38.8% |
| Cheyenne | 0.0 /100 | #298 | Tragic 38.7% |
Demographics Similar to Bulgarians by Associate's Degree
In terms of associate's degree, the demographic groups most similar to Bulgarians are Russian (53.2%, a difference of 0.060%), Israeli (53.4%, a difference of 0.19%), Immigrants from Turkey (53.4%, a difference of 0.31%), Immigrants from Northern Europe (53.5%, a difference of 0.34%), and Immigrants from Russia (53.1%, a difference of 0.35%).
| Demographics | Rating | Rank | Associate's Degree |
| Latvians | 100.0 /100 | #27 | Exceptional 53.9% |
| Turks | 100.0 /100 | #28 | Exceptional 53.9% |
| Immigrants | France | 100.0 /100 | #29 | Exceptional 53.9% |
| Immigrants | Sri Lanka | 100.0 /100 | #30 | Exceptional 53.7% |
| Immigrants | Northern Europe | 100.0 /100 | #31 | Exceptional 53.5% |
| Immigrants | Turkey | 100.0 /100 | #32 | Exceptional 53.4% |
| Israelis | 100.0 /100 | #33 | Exceptional 53.4% |
| Bulgarians | 100.0 /100 | #34 | Exceptional 53.3% |
| Russians | 100.0 /100 | #35 | Exceptional 53.2% |
| Immigrants | Russia | 100.0 /100 | #36 | Exceptional 53.1% |
| Immigrants | Denmark | 100.0 /100 | #37 | Exceptional 53.1% |
| Mongolians | 100.0 /100 | #38 | Exceptional 53.0% |
| Immigrants | Belarus | 99.9 /100 | #39 | Exceptional 52.8% |
| Immigrants | Latvia | 99.9 /100 | #40 | Exceptional 52.8% |
| Immigrants | Saudi Arabia | 99.9 /100 | #41 | Exceptional 52.6% |