Dominican vs Ute Associate's Degree
COMPARE
Dominican
Ute
Associate's Degree
Associate's Degree Comparison
Dominicans
Ute
39.3%
ASSOCIATE'S DEGREE
0.0/ 100
METRIC RATING
291st/ 347
METRIC RANK
38.6%
ASSOCIATE'S DEGREE
0.0/ 100
METRIC RATING
299th/ 347
METRIC RANK
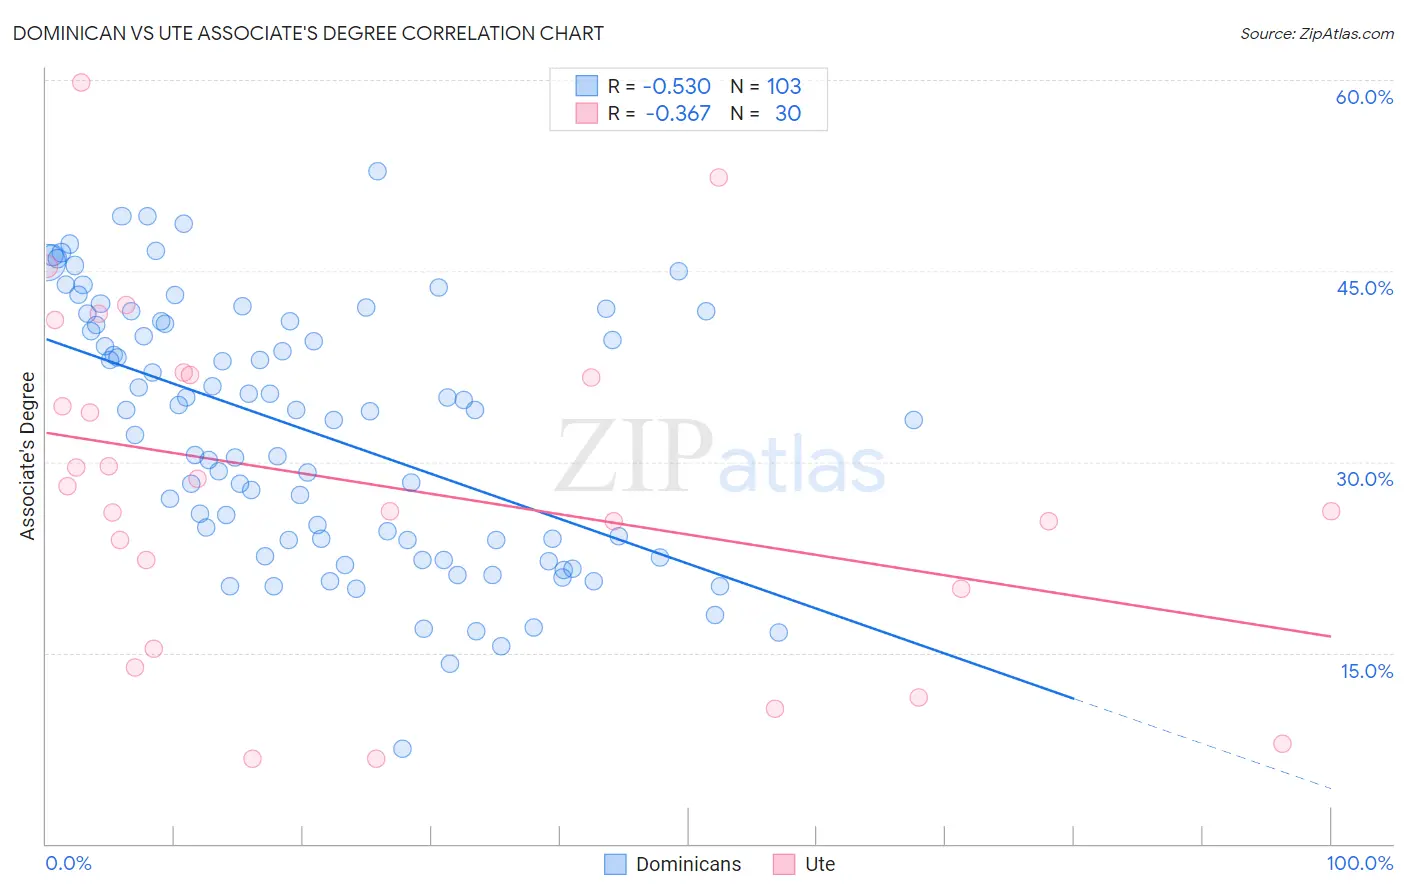
Dominican vs Ute Associate's Degree Correlation Chart
The statistical analysis conducted on geographies consisting of 355,098,353 people shows a substantial negative correlation between the proportion of Dominicans and percentage of population with at least associate's degree education in the United States with a correlation coefficient (R) of -0.530 and weighted average of 39.3%. Similarly, the statistical analysis conducted on geographies consisting of 55,668,197 people shows a mild negative correlation between the proportion of Ute and percentage of population with at least associate's degree education in the United States with a correlation coefficient (R) of -0.367 and weighted average of 38.6%, a difference of 1.7%.
Associate's Degree Correlation Summary
| Measurement | Dominican | Ute |
| Minimum | 7.4% | 6.7% |
| Maximum | 52.8% | 59.8% |
| Range | 45.4% | 53.1% |
| Mean | 32.3% | 28.2% |
| Median | 34.0% | 27.1% |
| Interquartile 25% (IQ1) | 23.8% | 20.0% |
| Interquartile 75% (IQ3) | 41.0% | 36.8% |
| Interquartile Range (IQR) | 17.2% | 16.8% |
| Standard Deviation (Sample) | 10.0% | 13.3% |
| Standard Deviation (Population) | 10.0% | 13.1% |
Demographics Similar to Dominicans and Ute by Associate's Degree
In terms of associate's degree, the demographic groups most similar to Dominicans are Immigrants from Haiti (39.3%, a difference of 0.010%), Black/African American (39.1%, a difference of 0.29%), Central American (39.4%, a difference of 0.46%), Nepalese (39.0%, a difference of 0.54%), and Salvadoran (39.0%, a difference of 0.54%). Similarly, the demographic groups most similar to Ute are Chickasaw (38.6%, a difference of 0.040%), Cheyenne (38.7%, a difference of 0.090%), Tsimshian (38.6%, a difference of 0.090%), Colville (38.5%, a difference of 0.24%), and Guatemalan (38.5%, a difference of 0.33%).
| Demographics | Rating | Rank | Associate's Degree |
| Immigrants | Belize | 0.1 /100 | #285 | Tragic 39.9% |
| Immigrants | Caribbean | 0.0 /100 | #286 | Tragic 39.7% |
| Aleuts | 0.0 /100 | #287 | Tragic 39.6% |
| Immigrants | Cuba | 0.0 /100 | #288 | Tragic 39.5% |
| Central Americans | 0.0 /100 | #289 | Tragic 39.4% |
| Immigrants | Haiti | 0.0 /100 | #290 | Tragic 39.3% |
| Dominicans | 0.0 /100 | #291 | Tragic 39.3% |
| Blacks/African Americans | 0.0 /100 | #292 | Tragic 39.1% |
| Nepalese | 0.0 /100 | #293 | Tragic 39.0% |
| Salvadorans | 0.0 /100 | #294 | Tragic 39.0% |
| Hondurans | 0.0 /100 | #295 | Tragic 38.9% |
| Cherokee | 0.0 /100 | #296 | Tragic 38.9% |
| Cape Verdeans | 0.0 /100 | #297 | Tragic 38.8% |
| Cheyenne | 0.0 /100 | #298 | Tragic 38.7% |
| Ute | 0.0 /100 | #299 | Tragic 38.6% |
| Chickasaw | 0.0 /100 | #300 | Tragic 38.6% |
| Tsimshian | 0.0 /100 | #301 | Tragic 38.6% |
| Colville | 0.0 /100 | #302 | Tragic 38.5% |
| Guatemalans | 0.0 /100 | #303 | Tragic 38.5% |
| Sioux | 0.0 /100 | #304 | Tragic 38.5% |
| Immigrants | Honduras | 0.0 /100 | #305 | Tragic 38.5% |