Dominican vs Swiss Associate's Degree
COMPARE
Dominican
Swiss
Associate's Degree
Associate's Degree Comparison
Dominicans
Swiss
39.3%
ASSOCIATE'S DEGREE
0.0/ 100
METRIC RATING
291st/ 347
METRIC RANK
46.0%
ASSOCIATE'S DEGREE
40.4/ 100
METRIC RATING
182nd/ 347
METRIC RANK
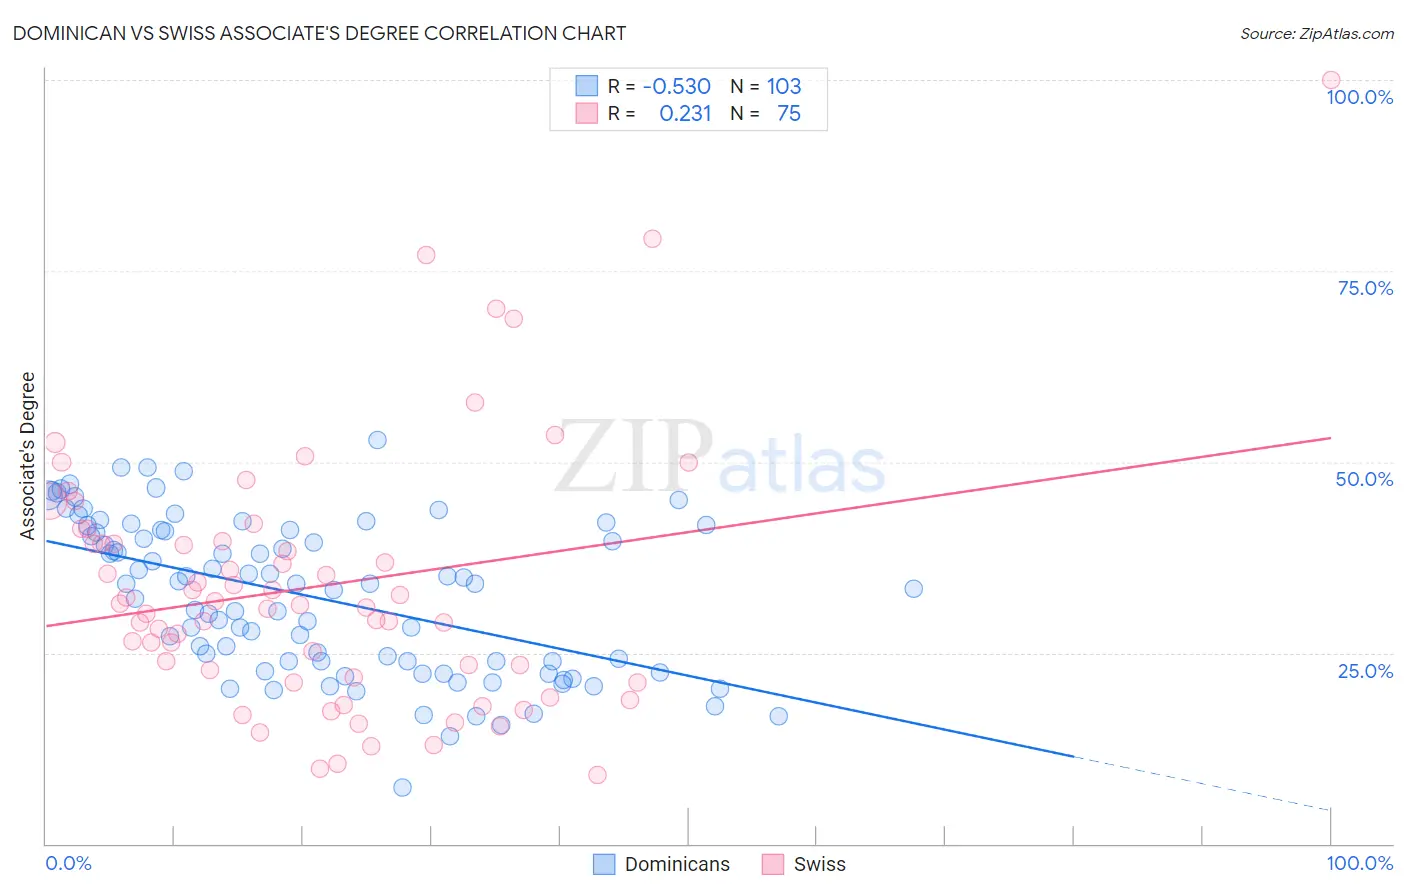
Dominican vs Swiss Associate's Degree Correlation Chart
The statistical analysis conducted on geographies consisting of 355,098,353 people shows a substantial negative correlation between the proportion of Dominicans and percentage of population with at least associate's degree education in the United States with a correlation coefficient (R) of -0.530 and weighted average of 39.3%. Similarly, the statistical analysis conducted on geographies consisting of 464,994,440 people shows a weak positive correlation between the proportion of Swiss and percentage of population with at least associate's degree education in the United States with a correlation coefficient (R) of 0.231 and weighted average of 46.0%, a difference of 17.2%.
Associate's Degree Correlation Summary
| Measurement | Dominican | Swiss |
| Minimum | 7.4% | 8.9% |
| Maximum | 52.8% | 100.0% |
| Range | 45.4% | 91.1% |
| Mean | 32.3% | 33.6% |
| Median | 34.0% | 31.2% |
| Interquartile 25% (IQ1) | 23.8% | 21.8% |
| Interquartile 75% (IQ3) | 41.0% | 39.6% |
| Interquartile Range (IQR) | 17.2% | 17.8% |
| Standard Deviation (Sample) | 10.0% | 16.9% |
| Standard Deviation (Population) | 10.0% | 16.8% |
Similar Demographics by Associate's Degree
Demographics Similar to Dominicans by Associate's Degree
In terms of associate's degree, the demographic groups most similar to Dominicans are Immigrants from Haiti (39.3%, a difference of 0.010%), Black/African American (39.1%, a difference of 0.29%), Central American (39.4%, a difference of 0.46%), Nepalese (39.0%, a difference of 0.54%), and Salvadoran (39.0%, a difference of 0.54%).
| Demographics | Rating | Rank | Associate's Degree |
| Comanche | 0.1 /100 | #284 | Tragic 39.9% |
| Immigrants | Belize | 0.1 /100 | #285 | Tragic 39.9% |
| Immigrants | Caribbean | 0.0 /100 | #286 | Tragic 39.7% |
| Aleuts | 0.0 /100 | #287 | Tragic 39.6% |
| Immigrants | Cuba | 0.0 /100 | #288 | Tragic 39.5% |
| Central Americans | 0.0 /100 | #289 | Tragic 39.4% |
| Immigrants | Haiti | 0.0 /100 | #290 | Tragic 39.3% |
| Dominicans | 0.0 /100 | #291 | Tragic 39.3% |
| Blacks/African Americans | 0.0 /100 | #292 | Tragic 39.1% |
| Nepalese | 0.0 /100 | #293 | Tragic 39.0% |
| Salvadorans | 0.0 /100 | #294 | Tragic 39.0% |
| Hondurans | 0.0 /100 | #295 | Tragic 38.9% |
| Cherokee | 0.0 /100 | #296 | Tragic 38.9% |
| Cape Verdeans | 0.0 /100 | #297 | Tragic 38.8% |
| Cheyenne | 0.0 /100 | #298 | Tragic 38.7% |
Demographics Similar to Swiss by Associate's Degree
In terms of associate's degree, the demographic groups most similar to Swiss are Yugoslavian (46.0%, a difference of 0.010%), Czechoslovakian (46.0%, a difference of 0.030%), Immigrants from Colombia (46.0%, a difference of 0.070%), Costa Rican (46.0%, a difference of 0.14%), and Welsh (45.9%, a difference of 0.20%).
| Demographics | Rating | Rank | Associate's Degree |
| Belgians | 48.9 /100 | #175 | Average 46.3% |
| Finns | 48.5 /100 | #176 | Average 46.3% |
| Slovaks | 48.4 /100 | #177 | Average 46.3% |
| Immigrants | Bosnia and Herzegovina | 48.3 /100 | #178 | Average 46.3% |
| Sri Lankans | 47.6 /100 | #179 | Average 46.3% |
| Bermudans | 46.4 /100 | #180 | Average 46.2% |
| Immigrants | Colombia | 41.3 /100 | #181 | Average 46.0% |
| Swiss | 40.4 /100 | #182 | Average 46.0% |
| Yugoslavians | 40.2 /100 | #183 | Average 46.0% |
| Czechoslovakians | 40.0 /100 | #184 | Average 46.0% |
| Costa Ricans | 38.6 /100 | #185 | Fair 46.0% |
| Welsh | 37.9 /100 | #186 | Fair 45.9% |
| Immigrants | Uruguay | 35.5 /100 | #187 | Fair 45.8% |
| Ghanaians | 35.5 /100 | #188 | Fair 45.8% |
| Immigrants | Oceania | 34.7 /100 | #189 | Fair 45.8% |