Dominican vs Luxembourger Associate's Degree
COMPARE
Dominican
Luxembourger
Associate's Degree
Associate's Degree Comparison
Dominicans
Luxembourgers
39.3%
ASSOCIATE'S DEGREE
0.0/ 100
METRIC RATING
291st/ 347
METRIC RANK
48.9%
ASSOCIATE'S DEGREE
95.1/ 100
METRIC RATING
115th/ 347
METRIC RANK
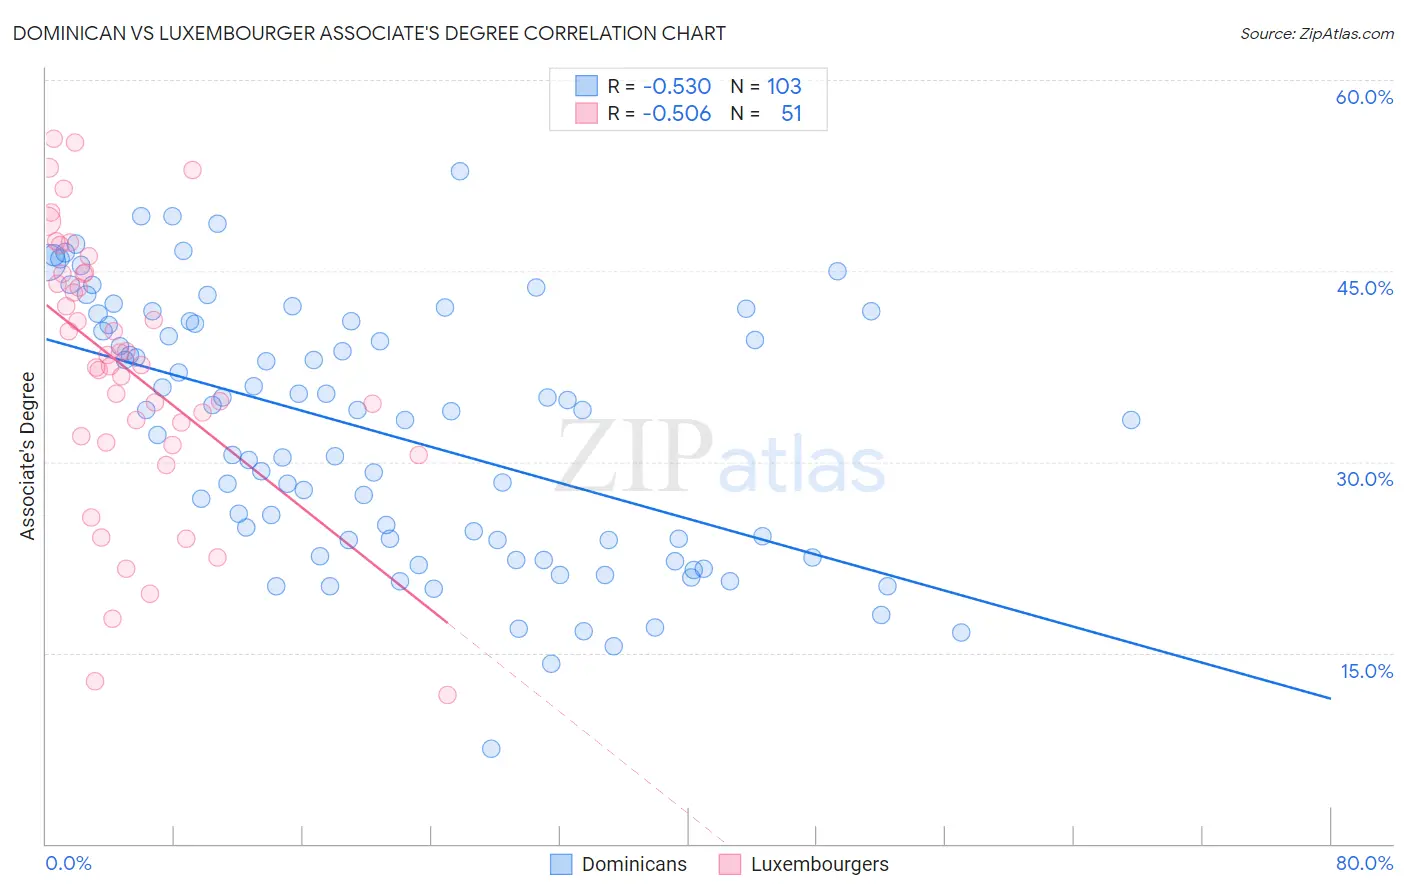
Dominican vs Luxembourger Associate's Degree Correlation Chart
The statistical analysis conducted on geographies consisting of 355,098,353 people shows a substantial negative correlation between the proportion of Dominicans and percentage of population with at least associate's degree education in the United States with a correlation coefficient (R) of -0.530 and weighted average of 39.3%. Similarly, the statistical analysis conducted on geographies consisting of 144,669,257 people shows a substantial negative correlation between the proportion of Luxembourgers and percentage of population with at least associate's degree education in the United States with a correlation coefficient (R) of -0.506 and weighted average of 48.9%, a difference of 24.6%.
Associate's Degree Correlation Summary
| Measurement | Dominican | Luxembourger |
| Minimum | 7.4% | 11.7% |
| Maximum | 52.8% | 55.4% |
| Range | 45.4% | 43.7% |
| Mean | 32.3% | 37.3% |
| Median | 34.0% | 37.6% |
| Interquartile 25% (IQ1) | 23.8% | 31.5% |
| Interquartile 75% (IQ3) | 41.0% | 44.8% |
| Interquartile Range (IQR) | 17.2% | 13.3% |
| Standard Deviation (Sample) | 10.0% | 10.5% |
| Standard Deviation (Population) | 10.0% | 10.4% |
Similar Demographics by Associate's Degree
Demographics Similar to Dominicans by Associate's Degree
In terms of associate's degree, the demographic groups most similar to Dominicans are Immigrants from Haiti (39.3%, a difference of 0.010%), Black/African American (39.1%, a difference of 0.29%), Central American (39.4%, a difference of 0.46%), Nepalese (39.0%, a difference of 0.54%), and Salvadoran (39.0%, a difference of 0.54%).
| Demographics | Rating | Rank | Associate's Degree |
| Comanche | 0.1 /100 | #284 | Tragic 39.9% |
| Immigrants | Belize | 0.1 /100 | #285 | Tragic 39.9% |
| Immigrants | Caribbean | 0.0 /100 | #286 | Tragic 39.7% |
| Aleuts | 0.0 /100 | #287 | Tragic 39.6% |
| Immigrants | Cuba | 0.0 /100 | #288 | Tragic 39.5% |
| Central Americans | 0.0 /100 | #289 | Tragic 39.4% |
| Immigrants | Haiti | 0.0 /100 | #290 | Tragic 39.3% |
| Dominicans | 0.0 /100 | #291 | Tragic 39.3% |
| Blacks/African Americans | 0.0 /100 | #292 | Tragic 39.1% |
| Nepalese | 0.0 /100 | #293 | Tragic 39.0% |
| Salvadorans | 0.0 /100 | #294 | Tragic 39.0% |
| Hondurans | 0.0 /100 | #295 | Tragic 38.9% |
| Cherokee | 0.0 /100 | #296 | Tragic 38.9% |
| Cape Verdeans | 0.0 /100 | #297 | Tragic 38.8% |
| Cheyenne | 0.0 /100 | #298 | Tragic 38.7% |
Demographics Similar to Luxembourgers by Associate's Degree
In terms of associate's degree, the demographic groups most similar to Luxembourgers are Immigrants from Chile (49.0%, a difference of 0.070%), Palestinian (49.0%, a difference of 0.070%), Arab (49.0%, a difference of 0.070%), British (48.9%, a difference of 0.070%), and Afghan (48.9%, a difference of 0.11%).
| Demographics | Rating | Rank | Associate's Degree |
| Jordanians | 96.6 /100 | #108 | Exceptional 49.2% |
| Immigrants | Morocco | 96.3 /100 | #109 | Exceptional 49.2% |
| Austrians | 95.8 /100 | #110 | Exceptional 49.1% |
| Immigrants | Venezuela | 95.8 /100 | #111 | Exceptional 49.1% |
| Immigrants | Chile | 95.3 /100 | #112 | Exceptional 49.0% |
| Palestinians | 95.3 /100 | #113 | Exceptional 49.0% |
| Arabs | 95.3 /100 | #114 | Exceptional 49.0% |
| Luxembourgers | 95.1 /100 | #115 | Exceptional 48.9% |
| British | 95.0 /100 | #116 | Exceptional 48.9% |
| Afghans | 94.8 /100 | #117 | Exceptional 48.9% |
| Albanians | 94.7 /100 | #118 | Exceptional 48.8% |
| Lebanese | 94.6 /100 | #119 | Exceptional 48.8% |
| Alsatians | 94.6 /100 | #120 | Exceptional 48.8% |
| Ugandans | 93.9 /100 | #121 | Exceptional 48.7% |
| Italians | 93.9 /100 | #122 | Exceptional 48.7% |