Dominican vs Korean Associate's Degree
COMPARE
Dominican
Korean
Associate's Degree
Associate's Degree Comparison
Dominicans
Koreans
39.3%
ASSOCIATE'S DEGREE
0.0/ 100
METRIC RATING
291st/ 347
METRIC RANK
45.8%
ASSOCIATE'S DEGREE
33.8/ 100
METRIC RATING
191st/ 347
METRIC RANK
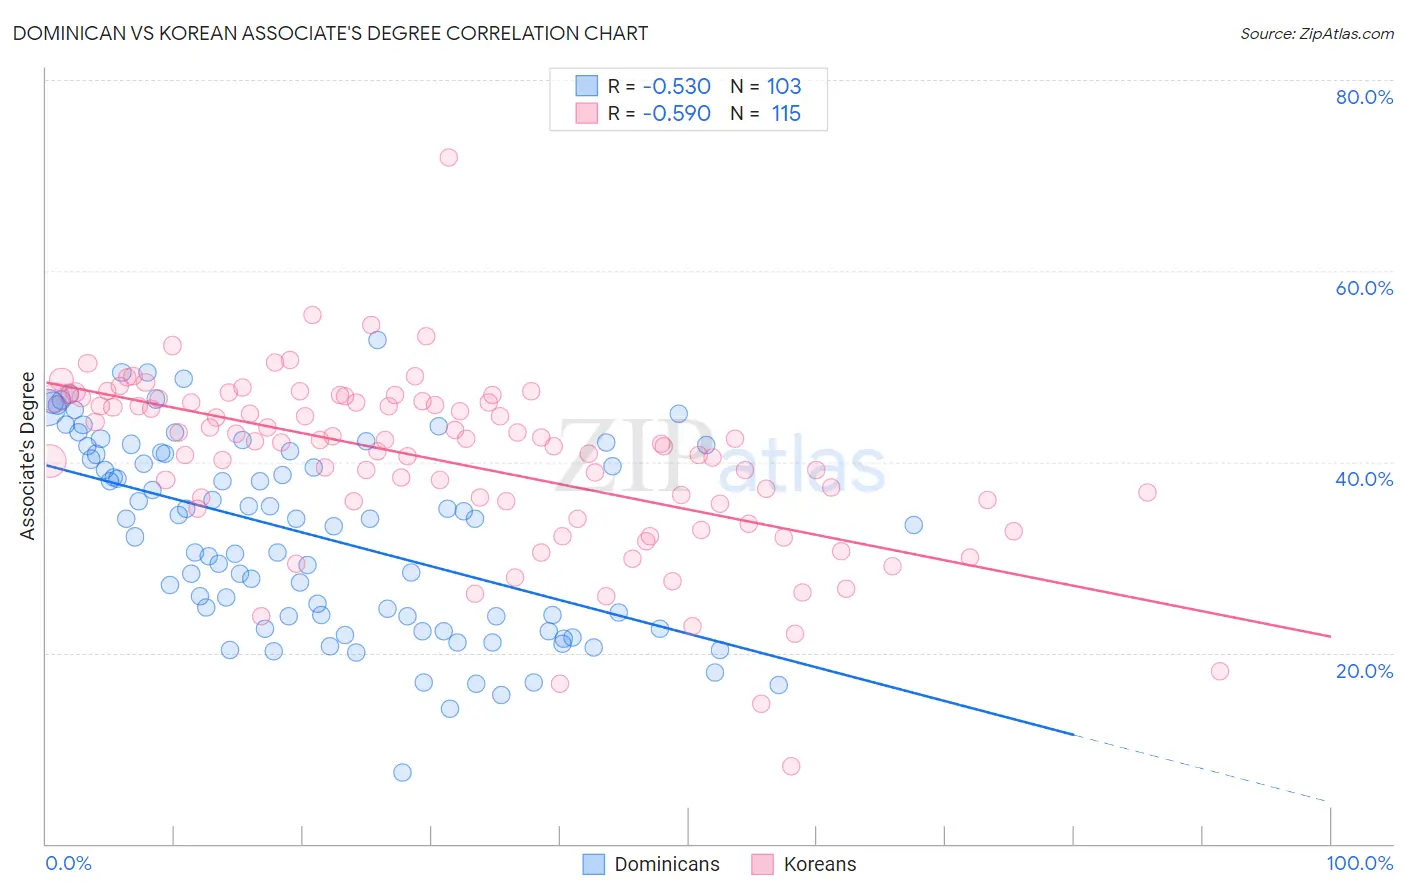
Dominican vs Korean Associate's Degree Correlation Chart
The statistical analysis conducted on geographies consisting of 355,098,353 people shows a substantial negative correlation between the proportion of Dominicans and percentage of population with at least associate's degree education in the United States with a correlation coefficient (R) of -0.530 and weighted average of 39.3%. Similarly, the statistical analysis conducted on geographies consisting of 510,898,568 people shows a substantial negative correlation between the proportion of Koreans and percentage of population with at least associate's degree education in the United States with a correlation coefficient (R) of -0.590 and weighted average of 45.8%, a difference of 16.6%.
Associate's Degree Correlation Summary
| Measurement | Dominican | Korean |
| Minimum | 7.4% | 8.1% |
| Maximum | 52.8% | 71.9% |
| Range | 45.4% | 63.8% |
| Mean | 32.3% | 40.0% |
| Median | 34.0% | 42.1% |
| Interquartile 25% (IQ1) | 23.8% | 35.6% |
| Interquartile 75% (IQ3) | 41.0% | 46.3% |
| Interquartile Range (IQR) | 17.2% | 10.7% |
| Standard Deviation (Sample) | 10.0% | 9.2% |
| Standard Deviation (Population) | 10.0% | 9.2% |
Similar Demographics by Associate's Degree
Demographics Similar to Dominicans by Associate's Degree
In terms of associate's degree, the demographic groups most similar to Dominicans are Immigrants from Haiti (39.3%, a difference of 0.010%), Black/African American (39.1%, a difference of 0.29%), Central American (39.4%, a difference of 0.46%), Nepalese (39.0%, a difference of 0.54%), and Salvadoran (39.0%, a difference of 0.54%).
| Demographics | Rating | Rank | Associate's Degree |
| Comanche | 0.1 /100 | #284 | Tragic 39.9% |
| Immigrants | Belize | 0.1 /100 | #285 | Tragic 39.9% |
| Immigrants | Caribbean | 0.0 /100 | #286 | Tragic 39.7% |
| Aleuts | 0.0 /100 | #287 | Tragic 39.6% |
| Immigrants | Cuba | 0.0 /100 | #288 | Tragic 39.5% |
| Central Americans | 0.0 /100 | #289 | Tragic 39.4% |
| Immigrants | Haiti | 0.0 /100 | #290 | Tragic 39.3% |
| Dominicans | 0.0 /100 | #291 | Tragic 39.3% |
| Blacks/African Americans | 0.0 /100 | #292 | Tragic 39.1% |
| Nepalese | 0.0 /100 | #293 | Tragic 39.0% |
| Salvadorans | 0.0 /100 | #294 | Tragic 39.0% |
| Hondurans | 0.0 /100 | #295 | Tragic 38.9% |
| Cherokee | 0.0 /100 | #296 | Tragic 38.9% |
| Cape Verdeans | 0.0 /100 | #297 | Tragic 38.8% |
| Cheyenne | 0.0 /100 | #298 | Tragic 38.7% |
Demographics Similar to Koreans by Associate's Degree
In terms of associate's degree, the demographic groups most similar to Koreans are Vietnamese (45.8%, a difference of 0.020%), Celtic (45.8%, a difference of 0.050%), Immigrants from Oceania (45.8%, a difference of 0.070%), Ghanaian (45.8%, a difference of 0.13%), and Immigrants from Uruguay (45.8%, a difference of 0.14%).
| Demographics | Rating | Rank | Associate's Degree |
| Czechoslovakians | 40.0 /100 | #184 | Average 46.0% |
| Costa Ricans | 38.6 /100 | #185 | Fair 46.0% |
| Welsh | 37.9 /100 | #186 | Fair 45.9% |
| Immigrants | Uruguay | 35.5 /100 | #187 | Fair 45.8% |
| Ghanaians | 35.5 /100 | #188 | Fair 45.8% |
| Immigrants | Oceania | 34.7 /100 | #189 | Fair 45.8% |
| Vietnamese | 34.0 /100 | #190 | Fair 45.8% |
| Koreans | 33.8 /100 | #191 | Fair 45.8% |
| Celtics | 33.3 /100 | #192 | Fair 45.8% |
| Immigrants | Cameroon | 31.0 /100 | #193 | Fair 45.7% |
| Immigrants | Peru | 27.6 /100 | #194 | Fair 45.5% |
| Germans | 26.5 /100 | #195 | Fair 45.5% |
| French | 25.6 /100 | #196 | Fair 45.4% |
| Scotch-Irish | 22.3 /100 | #197 | Fair 45.3% |
| Immigrants | Bangladesh | 21.3 /100 | #198 | Fair 45.2% |