Czech vs Immigrants from Argentina GED/Equivalency
COMPARE
Czech
Immigrants from Argentina
GED/Equivalency
GED/Equivalency Comparison
Czechs
Immigrants from Argentina
88.1%
GED/EQUIVALENCY
99.5/ 100
METRIC RATING
45th/ 347
METRIC RANK
86.6%
GED/EQUIVALENCY
86.5/ 100
METRIC RATING
138th/ 347
METRIC RANK
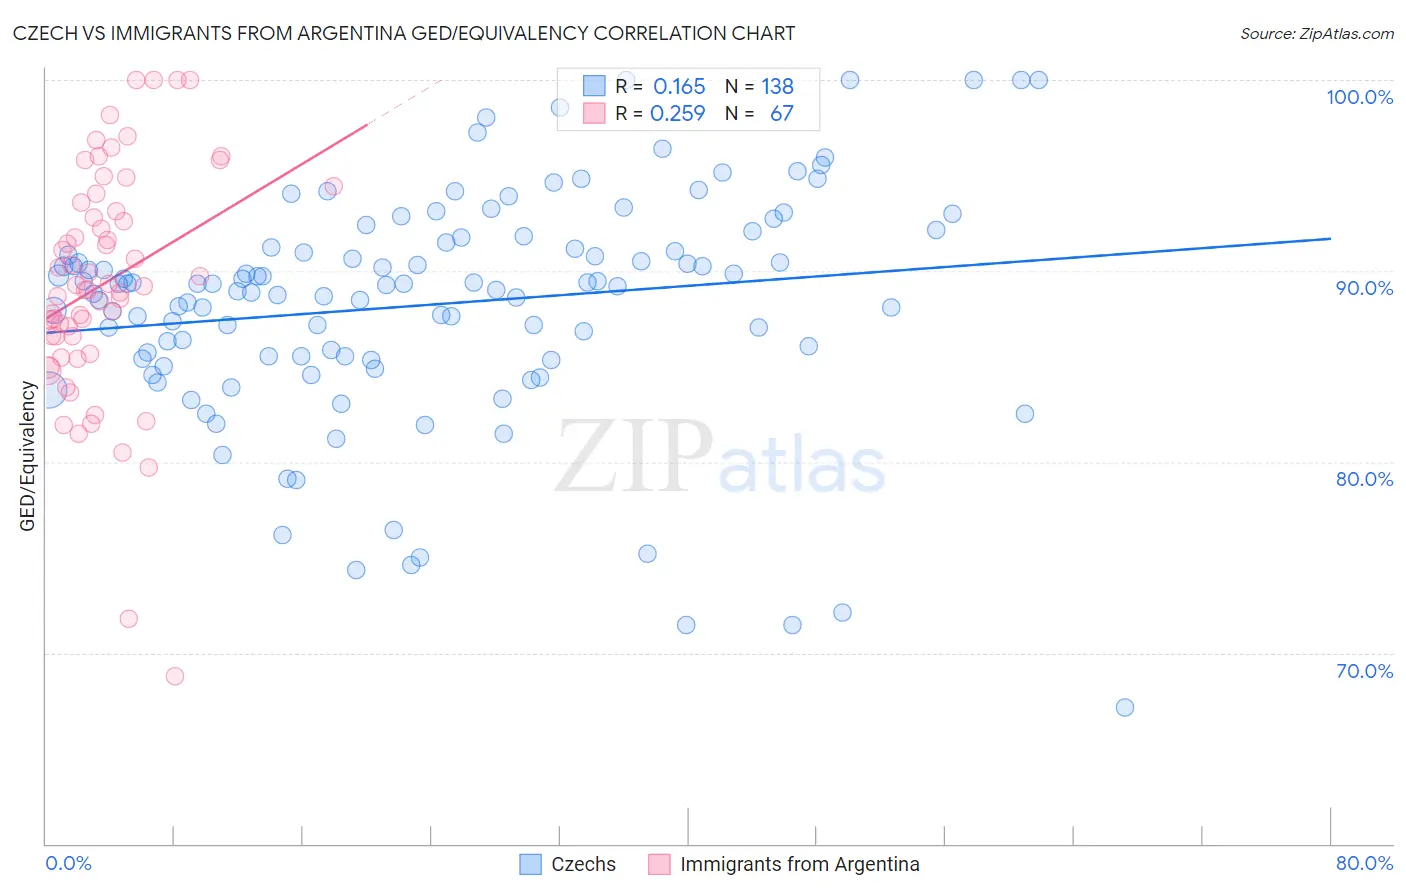
Czech vs Immigrants from Argentina GED/Equivalency Correlation Chart
The statistical analysis conducted on geographies consisting of 484,813,898 people shows a poor positive correlation between the proportion of Czechs and percentage of population with at least ged/equivalency education in the United States with a correlation coefficient (R) of 0.165 and weighted average of 88.1%. Similarly, the statistical analysis conducted on geographies consisting of 264,434,241 people shows a weak positive correlation between the proportion of Immigrants from Argentina and percentage of population with at least ged/equivalency education in the United States with a correlation coefficient (R) of 0.259 and weighted average of 86.6%, a difference of 1.8%.
GED/Equivalency Correlation Summary
| Measurement | Czech | Immigrants from Argentina |
| Minimum | 67.2% | 68.8% |
| Maximum | 100.0% | 100.0% |
| Range | 32.8% | 31.2% |
| Mean | 88.2% | 89.4% |
| Median | 89.3% | 89.2% |
| Interquartile 25% (IQ1) | 85.5% | 86.6% |
| Interquartile 75% (IQ3) | 91.2% | 93.6% |
| Interquartile Range (IQR) | 5.7% | 7.0% |
| Standard Deviation (Sample) | 6.0% | 6.1% |
| Standard Deviation (Population) | 6.0% | 6.0% |
Similar Demographics by GED/Equivalency
Demographics Similar to Czechs by GED/Equivalency
In terms of ged/equivalency, the demographic groups most similar to Czechs are Immigrants from Switzerland (88.1%, a difference of 0.020%), Immigrants from Latvia (88.1%, a difference of 0.030%), Greek (88.1%, a difference of 0.030%), Macedonian (88.1%, a difference of 0.040%), and Australian (88.1%, a difference of 0.040%).
| Demographics | Rating | Rank | GED/Equivalency |
| Burmese | 99.7 /100 | #38 | Exceptional 88.3% |
| Immigrants | Israel | 99.6 /100 | #39 | Exceptional 88.2% |
| Italians | 99.6 /100 | #40 | Exceptional 88.2% |
| Finns | 99.6 /100 | #41 | Exceptional 88.2% |
| Cambodians | 99.6 /100 | #42 | Exceptional 88.2% |
| Immigrants | Scotland | 99.6 /100 | #43 | Exceptional 88.2% |
| Macedonians | 99.5 /100 | #44 | Exceptional 88.1% |
| Czechs | 99.5 /100 | #45 | Exceptional 88.1% |
| Immigrants | Switzerland | 99.5 /100 | #46 | Exceptional 88.1% |
| Immigrants | Latvia | 99.5 /100 | #47 | Exceptional 88.1% |
| Greeks | 99.5 /100 | #48 | Exceptional 88.1% |
| Australians | 99.5 /100 | #49 | Exceptional 88.1% |
| Immigrants | Korea | 99.5 /100 | #50 | Exceptional 88.1% |
| Immigrants | Netherlands | 99.4 /100 | #51 | Exceptional 88.0% |
| Zimbabweans | 99.4 /100 | #52 | Exceptional 88.0% |
Demographics Similar to Immigrants from Argentina by GED/Equivalency
In terms of ged/equivalency, the demographic groups most similar to Immigrants from Argentina are Arab (86.6%, a difference of 0.010%), Chilean (86.6%, a difference of 0.020%), Immigrants from Asia (86.6%, a difference of 0.040%), Albanian (86.6%, a difference of 0.050%), and Immigrants from Malaysia (86.5%, a difference of 0.060%).
| Demographics | Rating | Rank | GED/Equivalency |
| Immigrants | Spain | 88.5 /100 | #131 | Excellent 86.7% |
| Immigrants | Brazil | 88.4 /100 | #132 | Excellent 86.6% |
| Tsimshian | 88.3 /100 | #133 | Excellent 86.6% |
| Albanians | 87.7 /100 | #134 | Excellent 86.6% |
| Immigrants | Asia | 87.4 /100 | #135 | Excellent 86.6% |
| Chileans | 86.9 /100 | #136 | Excellent 86.6% |
| Arabs | 86.7 /100 | #137 | Excellent 86.6% |
| Immigrants | Argentina | 86.5 /100 | #138 | Excellent 86.6% |
| Immigrants | Malaysia | 85.0 /100 | #139 | Excellent 86.5% |
| Paraguayans | 84.1 /100 | #140 | Excellent 86.5% |
| Laotians | 83.2 /100 | #141 | Excellent 86.5% |
| Immigrants | Indonesia | 82.4 /100 | #142 | Excellent 86.4% |
| Immigrants | Pakistan | 82.4 /100 | #143 | Excellent 86.4% |
| Bolivians | 82.1 /100 | #144 | Excellent 86.4% |
| Pakistanis | 80.4 /100 | #145 | Excellent 86.4% |