British West Indian vs Immigrants from Argentina GED/Equivalency
COMPARE
British West Indian
Immigrants from Argentina
GED/Equivalency
GED/Equivalency Comparison
British West Indians
Immigrants from Argentina
82.0%
GED/EQUIVALENCY
0.0/ 100
METRIC RATING
293rd/ 347
METRIC RANK
86.6%
GED/EQUIVALENCY
86.5/ 100
METRIC RATING
138th/ 347
METRIC RANK
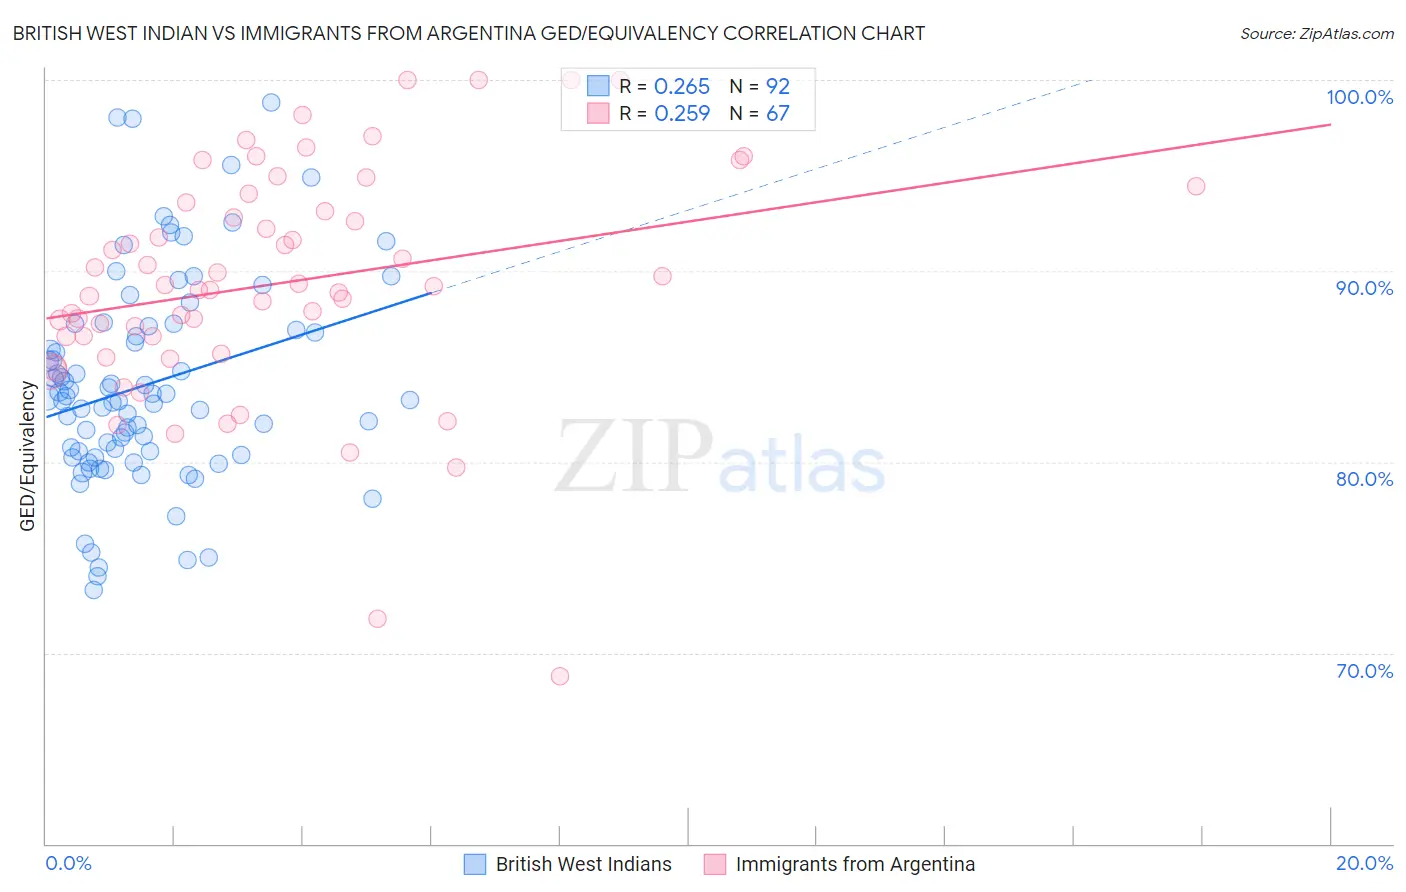
British West Indian vs Immigrants from Argentina GED/Equivalency Correlation Chart
The statistical analysis conducted on geographies consisting of 152,614,591 people shows a weak positive correlation between the proportion of British West Indians and percentage of population with at least ged/equivalency education in the United States with a correlation coefficient (R) of 0.265 and weighted average of 82.0%. Similarly, the statistical analysis conducted on geographies consisting of 264,434,241 people shows a weak positive correlation between the proportion of Immigrants from Argentina and percentage of population with at least ged/equivalency education in the United States with a correlation coefficient (R) of 0.259 and weighted average of 86.6%, a difference of 5.6%.
GED/Equivalency Correlation Summary
| Measurement | British West Indian | Immigrants from Argentina |
| Minimum | 73.3% | 68.8% |
| Maximum | 98.8% | 100.0% |
| Range | 25.5% | 31.2% |
| Mean | 84.1% | 89.4% |
| Median | 83.3% | 89.2% |
| Interquartile 25% (IQ1) | 80.4% | 86.6% |
| Interquartile 75% (IQ3) | 87.0% | 93.6% |
| Interquartile Range (IQR) | 6.6% | 7.0% |
| Standard Deviation (Sample) | 5.4% | 6.1% |
| Standard Deviation (Population) | 5.4% | 6.0% |
Similar Demographics by GED/Equivalency
Demographics Similar to British West Indians by GED/Equivalency
In terms of ged/equivalency, the demographic groups most similar to British West Indians are Paiute (82.0%, a difference of 0.010%), Immigrants from St. Vincent and the Grenadines (82.0%, a difference of 0.030%), Cuban (82.0%, a difference of 0.040%), Haitian (82.1%, a difference of 0.070%), and Nepalese (81.9%, a difference of 0.080%).
| Demographics | Rating | Rank | GED/Equivalency |
| Immigrants | West Indies | 0.0 /100 | #286 | Tragic 82.4% |
| Japanese | 0.0 /100 | #287 | Tragic 82.4% |
| Pueblo | 0.0 /100 | #288 | Tragic 82.3% |
| Immigrants | Cambodia | 0.0 /100 | #289 | Tragic 82.2% |
| Haitians | 0.0 /100 | #290 | Tragic 82.1% |
| Cubans | 0.0 /100 | #291 | Tragic 82.0% |
| Paiute | 0.0 /100 | #292 | Tragic 82.0% |
| British West Indians | 0.0 /100 | #293 | Tragic 82.0% |
| Immigrants | St. Vincent and the Grenadines | 0.0 /100 | #294 | Tragic 82.0% |
| Nepalese | 0.0 /100 | #295 | Tragic 81.9% |
| Vietnamese | 0.0 /100 | #296 | Tragic 81.9% |
| Immigrants | Bangladesh | 0.0 /100 | #297 | Tragic 81.9% |
| Ute | 0.0 /100 | #298 | Tragic 81.8% |
| Ecuadorians | 0.0 /100 | #299 | Tragic 81.7% |
| Fijians | 0.0 /100 | #300 | Tragic 81.6% |
Demographics Similar to Immigrants from Argentina by GED/Equivalency
In terms of ged/equivalency, the demographic groups most similar to Immigrants from Argentina are Arab (86.6%, a difference of 0.010%), Chilean (86.6%, a difference of 0.020%), Immigrants from Asia (86.6%, a difference of 0.040%), Albanian (86.6%, a difference of 0.050%), and Immigrants from Malaysia (86.5%, a difference of 0.060%).
| Demographics | Rating | Rank | GED/Equivalency |
| Immigrants | Spain | 88.5 /100 | #131 | Excellent 86.7% |
| Immigrants | Brazil | 88.4 /100 | #132 | Excellent 86.6% |
| Tsimshian | 88.3 /100 | #133 | Excellent 86.6% |
| Albanians | 87.7 /100 | #134 | Excellent 86.6% |
| Immigrants | Asia | 87.4 /100 | #135 | Excellent 86.6% |
| Chileans | 86.9 /100 | #136 | Excellent 86.6% |
| Arabs | 86.7 /100 | #137 | Excellent 86.6% |
| Immigrants | Argentina | 86.5 /100 | #138 | Excellent 86.6% |
| Immigrants | Malaysia | 85.0 /100 | #139 | Excellent 86.5% |
| Paraguayans | 84.1 /100 | #140 | Excellent 86.5% |
| Laotians | 83.2 /100 | #141 | Excellent 86.5% |
| Immigrants | Indonesia | 82.4 /100 | #142 | Excellent 86.4% |
| Immigrants | Pakistan | 82.4 /100 | #143 | Excellent 86.4% |
| Bolivians | 82.1 /100 | #144 | Excellent 86.4% |
| Pakistanis | 80.4 /100 | #145 | Excellent 86.4% |