Czech vs Immigrants from Argentina In Labor Force | Age 35-44
COMPARE
Czech
Immigrants from Argentina
In Labor Force | Age 35-44
In Labor Force | Age 35-44 Comparison
Czechs
Immigrants from Argentina
85.3%
IN LABOR FORCE | AGE 35-44
99.9/ 100
METRIC RATING
31st/ 347
METRIC RANK
84.8%
IN LABOR FORCE | AGE 35-44
94.5/ 100
METRIC RATING
108th/ 347
METRIC RANK
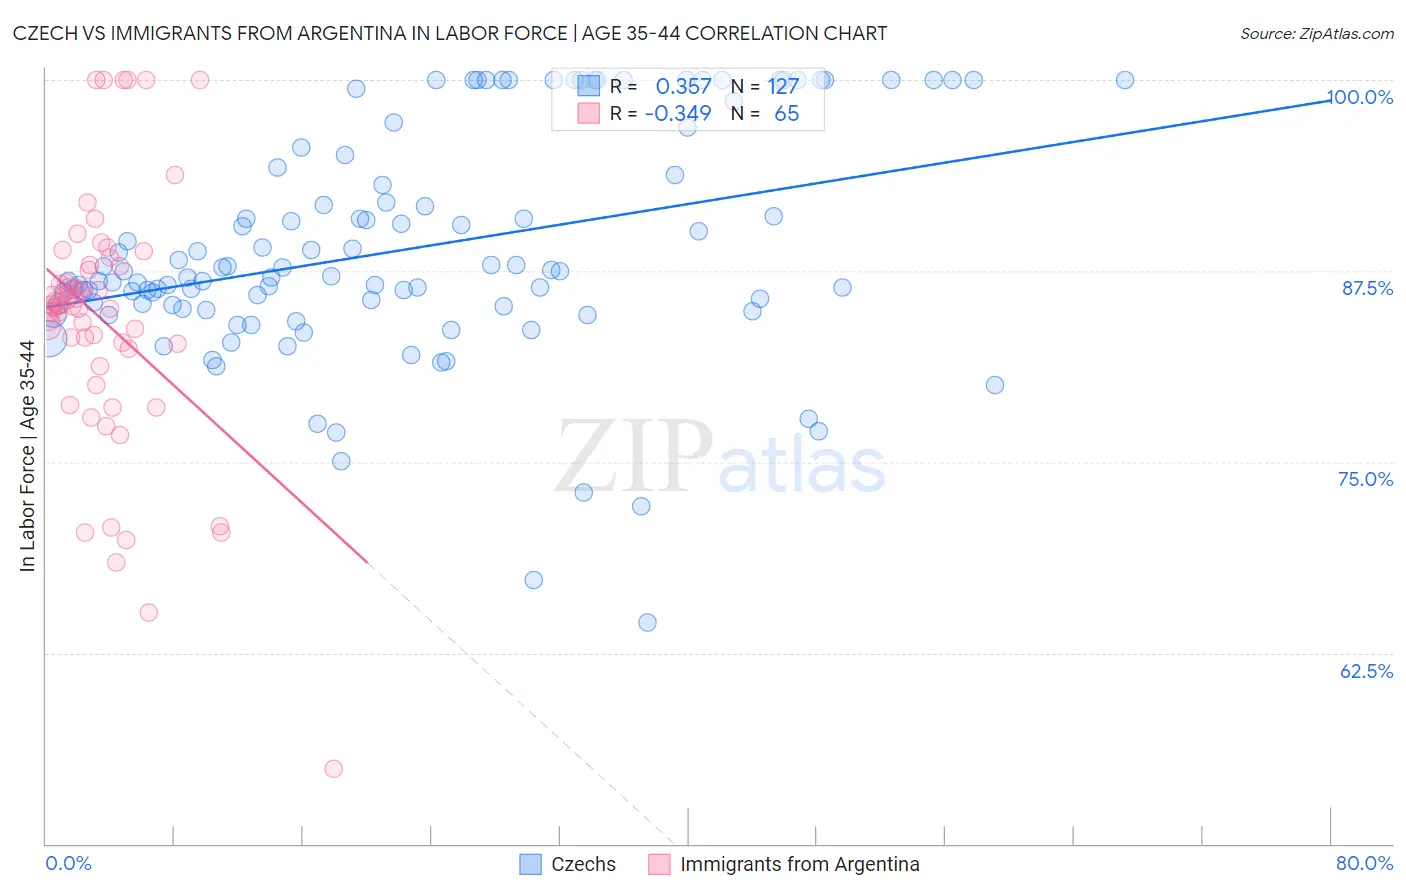
Czech vs Immigrants from Argentina In Labor Force | Age 35-44 Correlation Chart
The statistical analysis conducted on geographies consisting of 484,520,420 people shows a mild positive correlation between the proportion of Czechs and labor force participation rate among population between the ages 35 and 44 in the United States with a correlation coefficient (R) of 0.357 and weighted average of 85.3%. Similarly, the statistical analysis conducted on geographies consisting of 264,372,085 people shows a mild negative correlation between the proportion of Immigrants from Argentina and labor force participation rate among population between the ages 35 and 44 in the United States with a correlation coefficient (R) of -0.349 and weighted average of 84.8%, a difference of 0.64%.
In Labor Force | Age 35-44 Correlation Summary
| Measurement | Czech | Immigrants from Argentina |
| Minimum | 64.5% | 54.9% |
| Maximum | 100.0% | 100.0% |
| Range | 35.5% | 45.1% |
| Mean | 89.0% | 84.3% |
| Median | 87.1% | 85.2% |
| Interquartile 25% (IQ1) | 85.2% | 81.8% |
| Interquartile 75% (IQ3) | 94.3% | 87.8% |
| Interquartile Range (IQR) | 9.1% | 6.0% |
| Standard Deviation (Sample) | 7.4% | 8.5% |
| Standard Deviation (Population) | 7.4% | 8.4% |
Similar Demographics by In Labor Force | Age 35-44
Demographics Similar to Czechs by In Labor Force | Age 35-44
In terms of in labor force | age 35-44, the demographic groups most similar to Czechs are Bermudan (85.3%, a difference of 0.0%), Immigrants from India (85.3%, a difference of 0.0%), Ugandan (85.3%, a difference of 0.010%), Cambodian (85.3%, a difference of 0.020%), and Immigrants from Nepal (85.3%, a difference of 0.030%).
| Demographics | Rating | Rank | In Labor Force | Age 35-44 |
| Latvians | 99.9 /100 | #24 | Exceptional 85.4% |
| Paraguayans | 99.9 /100 | #25 | Exceptional 85.4% |
| Immigrants | Liberia | 99.9 /100 | #26 | Exceptional 85.4% |
| Immigrants | Lithuania | 99.9 /100 | #27 | Exceptional 85.4% |
| Immigrants | Greece | 99.9 /100 | #28 | Exceptional 85.3% |
| Cambodians | 99.9 /100 | #29 | Exceptional 85.3% |
| Bermudans | 99.9 /100 | #30 | Exceptional 85.3% |
| Czechs | 99.9 /100 | #31 | Exceptional 85.3% |
| Immigrants | India | 99.9 /100 | #32 | Exceptional 85.3% |
| Ugandans | 99.9 /100 | #33 | Exceptional 85.3% |
| Immigrants | Nepal | 99.9 /100 | #34 | Exceptional 85.3% |
| Estonians | 99.9 /100 | #35 | Exceptional 85.3% |
| Immigrants | Morocco | 99.8 /100 | #36 | Exceptional 85.2% |
| Kenyans | 99.8 /100 | #37 | Exceptional 85.2% |
| Immigrants | Poland | 99.8 /100 | #38 | Exceptional 85.2% |
Demographics Similar to Immigrants from Argentina by In Labor Force | Age 35-44
In terms of in labor force | age 35-44, the demographic groups most similar to Immigrants from Argentina are Immigrants from Russia (84.8%, a difference of 0.0%), Immigrants from Bahamas (84.8%, a difference of 0.010%), Immigrants from Romania (84.8%, a difference of 0.010%), Immigrants from Belarus (84.8%, a difference of 0.020%), and Immigrants from Sweden (84.8%, a difference of 0.020%).
| Demographics | Rating | Rank | In Labor Force | Age 35-44 |
| Immigrants | Australia | 95.5 /100 | #101 | Exceptional 84.8% |
| Immigrants | Southern Europe | 95.3 /100 | #102 | Exceptional 84.8% |
| Immigrants | Belarus | 95.3 /100 | #103 | Exceptional 84.8% |
| Immigrants | Sweden | 95.2 /100 | #104 | Exceptional 84.8% |
| South Americans | 95.0 /100 | #105 | Exceptional 84.8% |
| Immigrants | Bahamas | 94.8 /100 | #106 | Exceptional 84.8% |
| Immigrants | Romania | 94.7 /100 | #107 | Exceptional 84.8% |
| Immigrants | Argentina | 94.5 /100 | #108 | Exceptional 84.8% |
| Immigrants | Russia | 94.5 /100 | #109 | Exceptional 84.8% |
| Filipinos | 93.8 /100 | #110 | Exceptional 84.7% |
| Ukrainians | 93.5 /100 | #111 | Exceptional 84.7% |
| Immigrants | Western Africa | 93.4 /100 | #112 | Exceptional 84.7% |
| Uruguayans | 93.3 /100 | #113 | Exceptional 84.7% |
| Chileans | 93.2 /100 | #114 | Exceptional 84.7% |
| Bahamians | 93.2 /100 | #115 | Exceptional 84.7% |