Immigrants from Cabo Verde vs Immigrants from Argentina GED/Equivalency
COMPARE
Immigrants from Cabo Verde
Immigrants from Argentina
GED/Equivalency
GED/Equivalency Comparison
Immigrants from Cabo Verde
Immigrants from Argentina
78.9%
GED/EQUIVALENCY
0.0/ 100
METRIC RATING
330th/ 347
METRIC RANK
86.6%
GED/EQUIVALENCY
86.5/ 100
METRIC RATING
138th/ 347
METRIC RANK
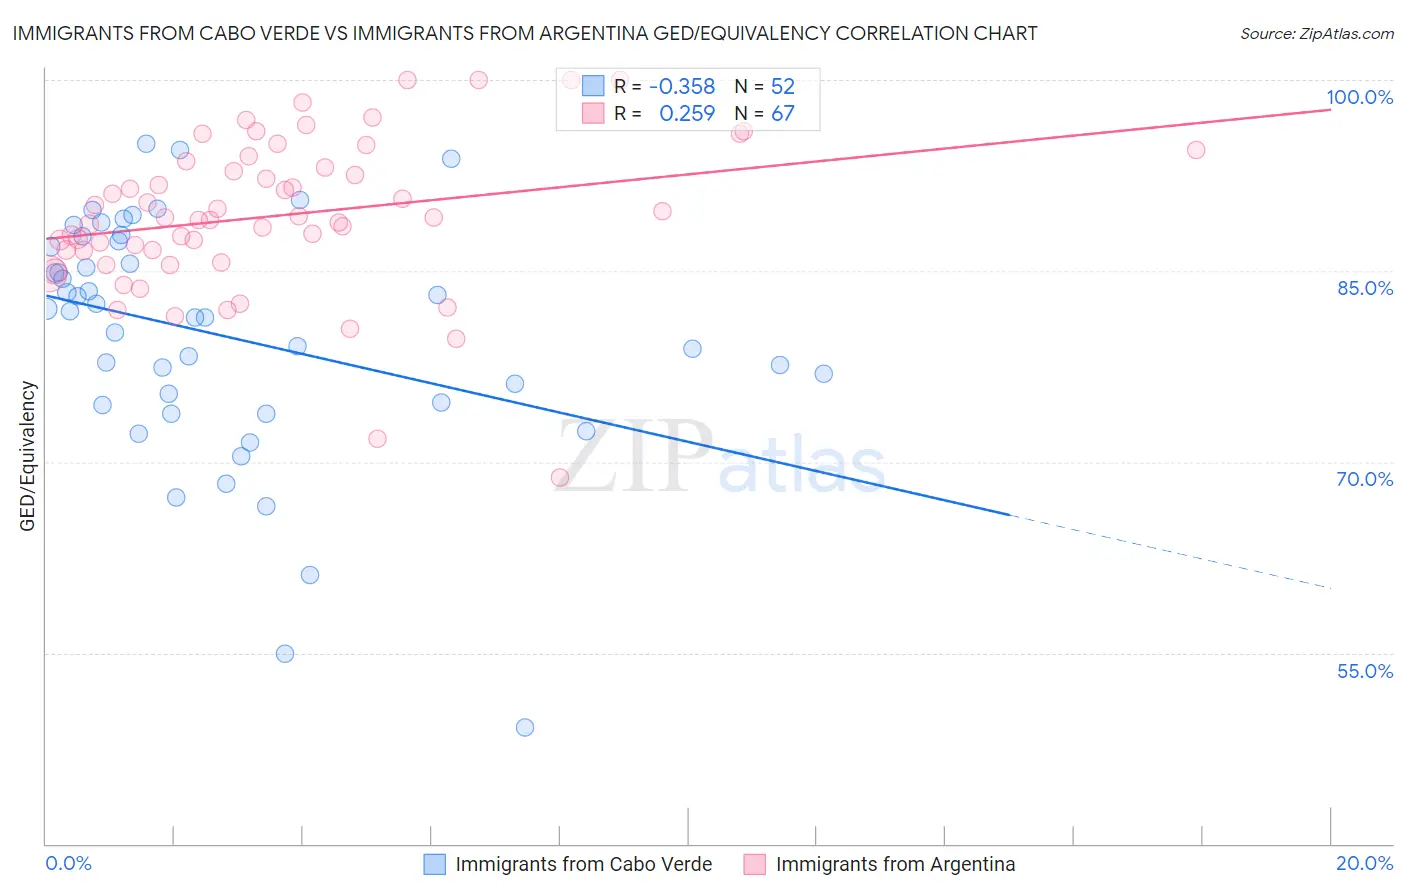
Immigrants from Cabo Verde vs Immigrants from Argentina GED/Equivalency Correlation Chart
The statistical analysis conducted on geographies consisting of 38,158,504 people shows a mild negative correlation between the proportion of Immigrants from Cabo Verde and percentage of population with at least ged/equivalency education in the United States with a correlation coefficient (R) of -0.358 and weighted average of 78.9%. Similarly, the statistical analysis conducted on geographies consisting of 264,434,241 people shows a weak positive correlation between the proportion of Immigrants from Argentina and percentage of population with at least ged/equivalency education in the United States with a correlation coefficient (R) of 0.259 and weighted average of 86.6%, a difference of 9.7%.
GED/Equivalency Correlation Summary
| Measurement | Immigrants from Cabo Verde | Immigrants from Argentina |
| Minimum | 49.2% | 68.8% |
| Maximum | 95.0% | 100.0% |
| Range | 45.8% | 31.2% |
| Mean | 79.9% | 89.4% |
| Median | 81.6% | 89.2% |
| Interquartile 25% (IQ1) | 74.6% | 86.6% |
| Interquartile 75% (IQ3) | 87.1% | 93.6% |
| Interquartile Range (IQR) | 12.6% | 7.0% |
| Standard Deviation (Sample) | 9.5% | 6.1% |
| Standard Deviation (Population) | 9.4% | 6.0% |
Similar Demographics by GED/Equivalency
Demographics Similar to Immigrants from Cabo Verde by GED/Equivalency
In terms of ged/equivalency, the demographic groups most similar to Immigrants from Cabo Verde are Dominican (79.1%, a difference of 0.16%), Hispanic or Latino (79.1%, a difference of 0.20%), Immigrants from Honduras (78.7%, a difference of 0.24%), Central American (79.2%, a difference of 0.31%), and Yuman (79.2%, a difference of 0.33%).
| Demographics | Rating | Rank | GED/Equivalency |
| Immigrants | Nicaragua | 0.0 /100 | #323 | Tragic 79.9% |
| Mexican American Indians | 0.0 /100 | #324 | Tragic 79.4% |
| Hondurans | 0.0 /100 | #325 | Tragic 79.3% |
| Yuman | 0.0 /100 | #326 | Tragic 79.2% |
| Central Americans | 0.0 /100 | #327 | Tragic 79.2% |
| Hispanics or Latinos | 0.0 /100 | #328 | Tragic 79.1% |
| Dominicans | 0.0 /100 | #329 | Tragic 79.1% |
| Immigrants | Cabo Verde | 0.0 /100 | #330 | Tragic 78.9% |
| Immigrants | Honduras | 0.0 /100 | #331 | Tragic 78.7% |
| Immigrants | Azores | 0.0 /100 | #332 | Tragic 78.7% |
| Salvadorans | 0.0 /100 | #333 | Tragic 78.6% |
| Guatemalans | 0.0 /100 | #334 | Tragic 78.5% |
| Immigrants | Latin America | 0.0 /100 | #335 | Tragic 78.5% |
| Immigrants | Dominican Republic | 0.0 /100 | #336 | Tragic 78.0% |
| Immigrants | Yemen | 0.0 /100 | #337 | Tragic 77.9% |
Demographics Similar to Immigrants from Argentina by GED/Equivalency
In terms of ged/equivalency, the demographic groups most similar to Immigrants from Argentina are Arab (86.6%, a difference of 0.010%), Chilean (86.6%, a difference of 0.020%), Immigrants from Asia (86.6%, a difference of 0.040%), Albanian (86.6%, a difference of 0.050%), and Immigrants from Malaysia (86.5%, a difference of 0.060%).
| Demographics | Rating | Rank | GED/Equivalency |
| Immigrants | Spain | 88.5 /100 | #131 | Excellent 86.7% |
| Immigrants | Brazil | 88.4 /100 | #132 | Excellent 86.6% |
| Tsimshian | 88.3 /100 | #133 | Excellent 86.6% |
| Albanians | 87.7 /100 | #134 | Excellent 86.6% |
| Immigrants | Asia | 87.4 /100 | #135 | Excellent 86.6% |
| Chileans | 86.9 /100 | #136 | Excellent 86.6% |
| Arabs | 86.7 /100 | #137 | Excellent 86.6% |
| Immigrants | Argentina | 86.5 /100 | #138 | Excellent 86.6% |
| Immigrants | Malaysia | 85.0 /100 | #139 | Excellent 86.5% |
| Paraguayans | 84.1 /100 | #140 | Excellent 86.5% |
| Laotians | 83.2 /100 | #141 | Excellent 86.5% |
| Immigrants | Indonesia | 82.4 /100 | #142 | Excellent 86.4% |
| Immigrants | Pakistan | 82.4 /100 | #143 | Excellent 86.4% |
| Bolivians | 82.1 /100 | #144 | Excellent 86.4% |
| Pakistanis | 80.4 /100 | #145 | Excellent 86.4% |